Curated OER
Matrix Operations
Students solve problems using matrices. In this algebra lesson, students add, subtract and multiply matrices. They use the graphing calculator to simplify and graph linear equations.
Curated OER
Unit 5: Worksheet 5 - Estimation & Probability
In this estimation worksheet, learners interpret given data and estimate fish populations. Students write a conclusion of their findings. Afterwards, they determine the probability of given events. This two-page worksheet contains...
National Renewable Energy Laboratory
Biomass: Biogas Generator
It's a gas. Middle schoolers build a biogas generator following the directions in this resource. After a few days of observation, they demonstrate that the gas given off by the decomposing manure is flammable. The activity concludes as...
Curated OER
How Do They Relate? Linear Relationship
Students collect information and use a line to represent it. In this algebra lesson, students investigate real world data to see if it makes a line. They graph the line comparing the relationship of the x axis with that of the...
Curated OER
Logarithms
In this Algebra II activity, 11th graders estimate the log of a number provided with a partial table of values and solve logarithmic equations. The one page interactive activity contains six problems. Answers and solutions are provided.
Curated OER
Limits and Functions
In this function worksheet, students compute the limits of given functions, they use differentials to estimate quantities, they compute the change in functional value and determine an equation for a line tangent to a graph. This...
Curated OER
Multistep Problems
In this multi-step problem solving worksheet, students analyze a chart that shows musical instruments and their prices. After reading the instructions and examples provided, students solve two multi-step problems.
Curated OER
Solving Percent Problems with Proportions
Seventh graders explore the concept of percent problems. In this percent problem lesson, 7th graders use proportion equations to solve percent problems. Students find percentages of numbers and use proportions to determine percents in...
Curated OER
Second Order ODE's
In this second order ODE's worksheet, students solve 2 different problems that are related to determining the second order ODE's in each equation given. First, they set up an equation where the applied force is the cosine plus the sine...
Curated OER
Conversions That Make Cents
Eighth graders practice calculating problems using addition, subtraction, multiplication and division. They estimate solutions to algebraic problems. They also graph their solutions.
Curated OER
How Many Bears in the Forest?
Third graders model the tag and recapture of bears and use proportions to estimate the population of the bears in their forest. This is a statistical sampling method used by scientists and naturalists to determine population numbers.
Curated OER
Mystery Stars: Estimating Whole Numbers Using Fractions Shown on Sectors of a Circle
In this set of fraction worksheets, students cut out 6 pages of circles that show fractions with stars covering different sections of circles. They show one section of the circle in order to estimate the whole number of stars by looking...
Curated OER
Buying My First Car
Students pretend they are about to buy their first new car. They must do all the calculations necessary to estimate the cost of purchasing the car. They see that the math they learn in school really does have real-life applications.
Curated OER
Around and Across
Tenth graders investigate the circumference and diameter of a circle. For this geometry lesson, 10th graders relate circumference to diameter. They create a scatter plot to estimate the value of pi.
Curated OER
The Mister Runtles' Bet
Students listen to a story dealing with exponential and linear growth. After reading the story, students complete a table comparing information. Using a calculator, students graph the rice and daily population of flies. They study the...
National Wildlife Federation
What is DBH?
When measuring the circumference of a tree, does it matter how high you place the measuring tape? Most scholars have never considered this question, but scientists know that measurement techniques must be standardized. The 13th lesson in...
Granite School District
7th Grade CCSS Math Vocabulary Word List
Address key vocabulary in the seventh grade Common Core Math Standards with this comprehensive list. A series of word cards is also provided that supports each term with images and examples, making this an excellent tool for teaching the...
Creative Chemistry
Simple Calorimetry to Find the Enthalpy of Combustion of Alcohols
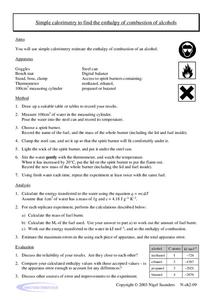
Accomplished chemistry learners set up a calorimeter and measured the energy released by various alcohols: methanol, ethanol, and either propanol or butanol. Lab masters will first need to design their tables for recording data. Consider...
Curated OER
Famous People: Student Worksheet
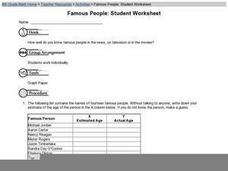
Older learners consider a list of famous people, and they fill in two columns; one in which they guess the celebrities' ages, and another where they look up their actual age. They construct a graph by assigning one of the columns...
Mathematics Assessment Project
College and Career Readiness Mathematics Test C2
Scholars apply knowledge learned over their high school math courses in order to determine their college readiness. The 20-page resource emphasizes applied problem solving.
Illustrative Mathematics
Ice Cream Cone
Every pupil with a sweet tooth will be clamoring for this lab and analysis, particularly when they're allowed to eat the results! Volume and surface area formulas for cones are developed from models, and then extended to the printing of...
101 Questions
Styrofoam Cups
How many cups does it take to reach the top? Learners attempt to answer this through a series of questions. They collect dimension information and apply it to creating a function. The lesson encourages various solution methods and...
Inside Mathematics
Functions
A function is like a machine that has an input and an output. Challenge scholars to look at the eight given points and determine the two functions that would fit four of the points each — one is linear and the other non-linear. The...
Illustrative Mathematics
Influenza epidemic
This activity presents a real-world problem about an epidemic of influenza spreading through a city. Learners refer to a graph that shows the number of individuals infected in relation to the number of weeks that have elapsed since...


