Curated OER
Regressive Music
Student use the Ti calculator to graph sinusoidal graphs. In this calculus lesson plan, students use the CBL to collect and analyze data of sinusoidal graphs. They manipulate their collected data and make predictions.
Pennsylvania Department of Education
Extending Pattern Understandings
Students use shapes and manipulatives to demonstrate patterns. In this patterns lesson plan, students also break up patterns to identify a pattern unit.
Curated OER
Estimation and Computation
Second graders practice their estimation skills using blocks. In this math lesson, 2nd graders explain how estimating makes addition easier. They complete a worksheet after the lesson to reinforce new learning.
Curated OER
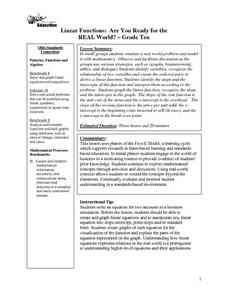
Linear Functions: Are You Ready for the REAL World?
students emulate a real world problem and model it with mathematics working in a small group. Observe and facilitate discussion as the groups use various strategies, such as (graphs, brainstorming, tables, and dialogue.
Curated OER
The Fat and the Lean
Students collect data on calorie intake. In this algebra instructional activity, students use the collection of data to make better eating decisions. They investigate the nutritional value in food using a graph and draw conclusion from...
Pennsylvania Department of Education
Using Multiplication to Solve Word Problems
Fourth graders solve word problems using multiplication. In this multiplication lesson, 4th graders write and solve word problems using their prior knowledge of multiplication.
Pennsylvania Department of Education
Comparing Sets
Students count back with cubes to model subtraction problems. In this subtraction lesson plan, students compare sets of problems and record their results in a table.
Curated OER
How Much Is Too Much?
Students examine population growth and collect data. In this statistics lesson, students create a scatter plot to represent the different species found in the water and are being harvested. They graph their data and draw conclusion from it.
Curated OER
Epidemic or False Alert?
In this rate instructional activity, students use the SIR model to determine if a disease is spreading at an epidemic rate. They find the slope of a curve and the slope of a line that goes through a given point. This two-page...
Curated OER
Finding Addition Patterns
Students practice finding the sums of two-one digit numbers. In this addition lesson plan, students also record facts onto an addition chart.
Curated OER
High and Low Tides
Students collect real world data from the Web regarding high and low tides at various locations in the United States. They find a function which models this data and make predictions on tide levels based on the information found.
Curated OER
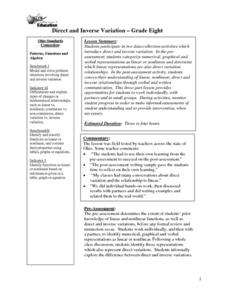
Direct and Inverse Variation
Eighth graders participate in two data collection activities that involve direct and inverse variation. In the pre-assessment, 8th graders categorize numerical, graphical, and verbal representations as linear or nonlinear and determine...
Curated OER
Getting it Right!
Students investigate error. As shown in earlier activities from navigation lessons 1 through 3, without an understanding of how errors can affect position, one cannot navigate well. Students explore how computers can help in navigation....
Curated OER
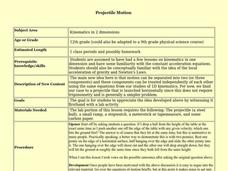
Projectile Motion
Twelfth graders experiment with a projectile that is launched horizontally after a demonstration and small discussion about two pennies, one dropping from a table top and the other being slide off the top and hitting the ground at about...
Curated OER
Algebra 2/Trigonometry Regents Exam
Students review for the Regents Exam. In this math lesson, students review core concept for the Regents exam by working a variety of problems. A printable worksheet is provided.
Curated OER
Algebra 2/Trigonometry Regents Exam
Twelfth graders test their knowledge of Algebra II and Trigonometry. In this Algebra II/Trigonometry lesson, 12th graders are provided with a copy of an Algebra II/Trigonometry Regent Exam from the fall of 2009. The exam has...
Curated OER
The Process Of Addition
Students use manipulatives to explore the notation of addition and gain experience with independent practice. They demonstrate their knowledge by performing the operation on the board with magnets, on their own felt work mat then on...
Curated OER
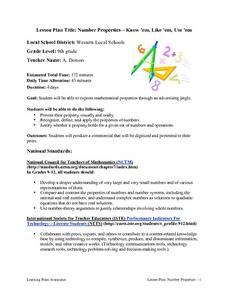
Number Properties - Know 'em, Like 'em, Use 'em
Ninth graders express mathematical properties through creation of advertising jingles.
Curated OER
Exploring Function Graphs
Tenth graders investigate three different sets of data that relate temperature to another variable in the physical world. These illustrate linear, inverse and exponential relationships.
Curated OER
Solving Problems Involving Chords, Radii, Tangents, Secants and Arcs within the Same Circle
Tenth graders apply their knowledge of angles related to a circle, radii, secants, tangents and chords of a circle. They practice using formulas related to a circle. They also apply what has been practiced to real life situations.
Curated OER
Describing Patterns
Fourth graders investigate repeating and growing patterns. Models, graphs and words are used to describe, extend and represent patterns. Students use evidence from models and graphs to support the identification of patterns.
Curated OER
Number Properties-Know'em, Like'em, Use'em
Ninth graders explore mathematical properties through the use of an advertising jingle. They produce a commercial that is digitized and presented to the class. Students write a jingle that simplifies each property and helps classmates...
Curated OER
Free Fall Graphing Exercise
Twelfth graders practice their graphing skills in an exercise about acceleration due to gravity. Lesson opens with a demonstration of acceleration due to gravity and a brief discussion. Students complete a worksheet and go over answers...
Curated OER
Worksheet 8 - Spring 1996
In this math worksheet, students sketch the graphs of the functions 1/x 2 and 1/(x2 − 1) over the interval [2, ∞). They rewrite the series using the Riemann sum.


