Hi, what do you want to do?
Alabama Learning Exchange
Alex: Statistically Thinking
The object of this project is for students to learn how to find univariate and bivariate statistics for sets of data. Also, the students will be able to determine if two sets of data are linearly correlated and to what degree. The...
TeachEngineering
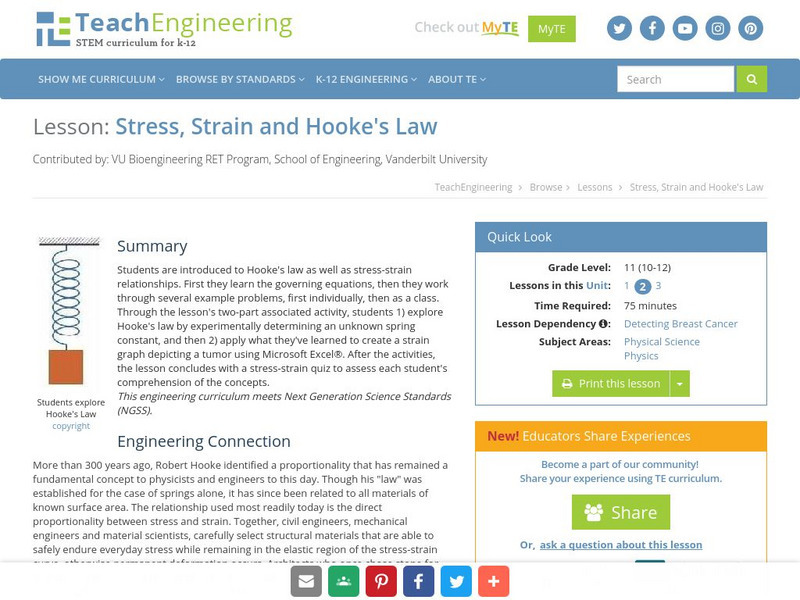
Teach Engineering: Stress, Strain and Hooke's Law
This lesson offers an introduction to Hooke's Law as well as stress-strain relationships. Students will first learn the governing equations. Then students will work through several example problems first individually, then as a class. In...
TeachEngineering
Teach Engineering: Presenting Painless Breast Cancer Detection!
This lesson culminates the unit with the Go Public phase of the legacy cycle. In the associated activity, students must depict a tumor amidst healthy body tissue using a graph in Microsoft Excel. In addition, students will design a...
Science Education Resource Center at Carleton College
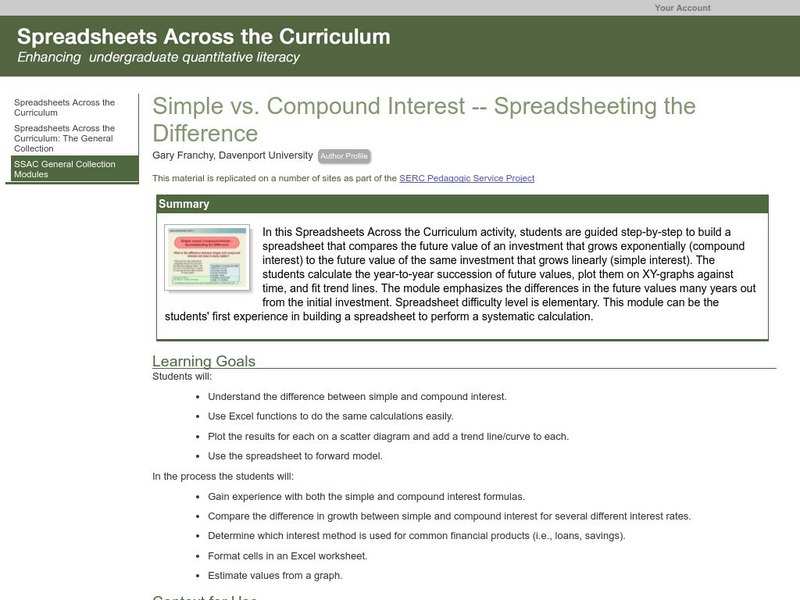
Serc: Simple vs. Compound Interest Spreadsheeting the Difference
A lesson plan that includes a PowerPoint learning module for students. The goal of the lesson is to learn the difference between simple and compound interest and to use the functions in Excel to perform the calculations and graph the data.
Discovery Education
Discovery Education: Comparing Countries
Excellent lesson in which students make predictions and collect information about the United States, China, and the Democratic Republic of Congo. After collecting data, students compare the information and create graphs to display the data.
Other popular searches
- Circle Graph in Excel
- Excel Graphs and Charts
- Excel Graphs Eye Color
- Free Excel Graphs
- Excel Graphs M&m
- Creating Graphs in Excel
- Creating Excel Graphs
- Scatter Plot Graphs Excel
- Excel Graphs Mm
- Bi Excel Graphs
- Data Graphs on Microsoft Excel
- Making Graphs With Excel


