Hi, what do you want to do?
TeachEngineering
Teach Engineering: Latex Tubing and Hybrid Vehicles
This unit gives students the opportunity to make use of linear models in order to make predictions based on real-world data. Students experience how engineers address incredible and important design challenges through the use of linear...
Other
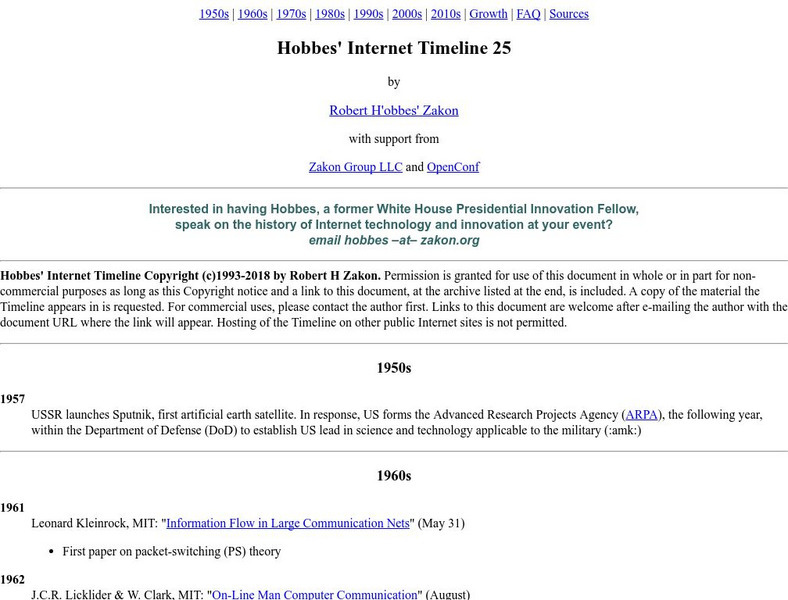
Hobbes' Internet Timeline
A comprehensive timeline of the internet. Includes excellent graphs and charts illustrating internet trends.
Department of Defense
Do Dea: Spreadsheet Software Applications: M4: L1: Chart It! Working With Charts
In Module 4 Lesson 1 of this course on spreadsheets, students learn how to build a chart from their spreadsheet data so that it is easier to interpret. Includes a glossary and slideshow tutorials.
Texas Instruments
Texas Instruments: Math Today Challenge New Color of Money
In this activity, students will read about the changes in the "new money" and then create a graph to represent various combinations of currency produced. This activity provides an excellent example of discrete, real-world data.
Other
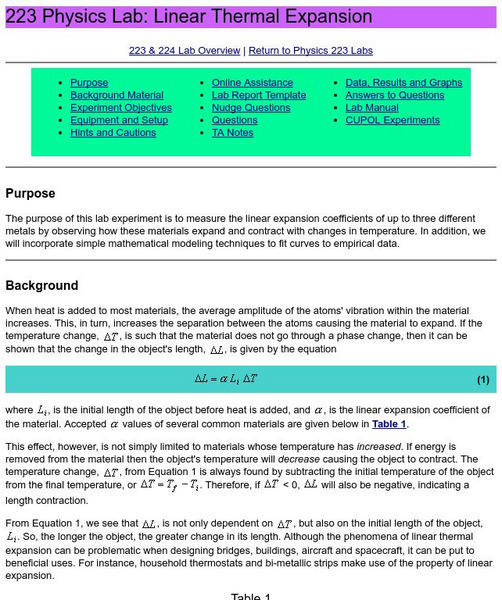
Clemson University: Linear Thermal Expansion
Clemson University offers an excellent site of linear thermal expansion lab. Includes experiment, images, charts, links, questions, and much more.
Alabama Learning Exchange
Alex: Statistically Thinking
The object of this project is for students to learn how to find univariate and bivariate statistics for sets of data. Also, the students will be able to determine if two sets of data are linearly correlated and to what degree. The...
US Department of Education
Helping Your Child Learn Math: Math on the Go
Parents and children explore math in the world around them in this collection of math activities. Simple, engaging, and fun, these lessons offer learners the opportunity to discover math even when they're "on the go." An excellent...
University of Waterloo (Canada)
Wired Math: Organizing Data Grade 7 [Pdf]
A collection of worksheets that focus on data analysis and organizing data. Includes detailed examples, colorful visuals, and a link to a related game. Acrobat Reader required.
Math Slice
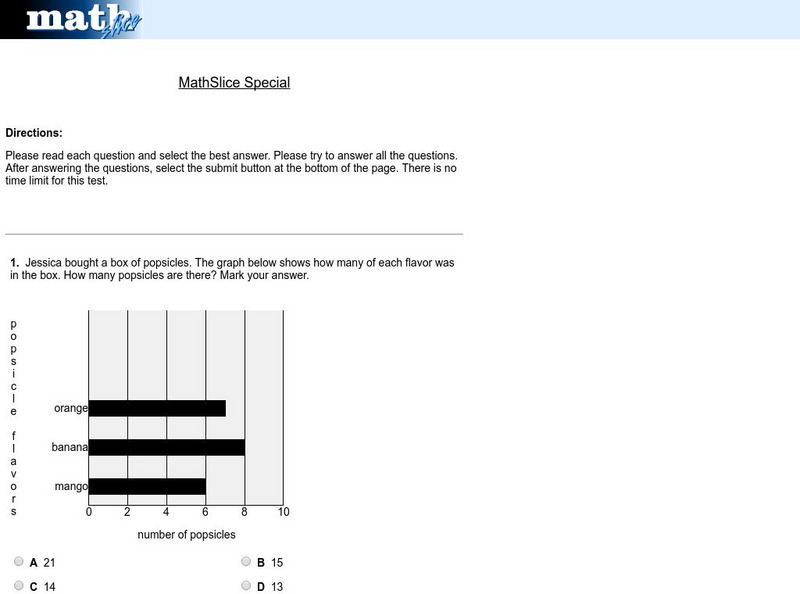
Math Slice: Chart Slice Special Test
A ten question test assessing data collection and analysis skills with bar graphs. Assessment is scored online. An excellent tool for assessment.
Curated OER
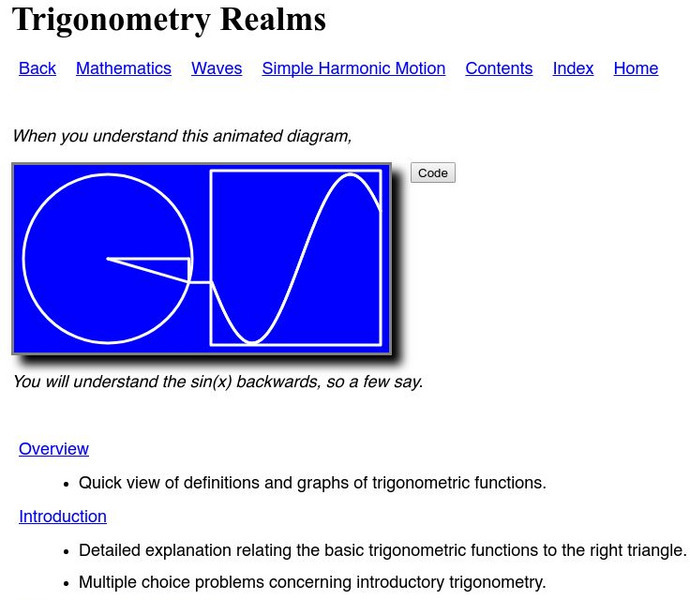
Trigonometry Realms
Excellent site reviewing the realms of Trigonometry. Topics Include the trig functions, graphs, right triangles and much more.
Ohio State University
Osu: Beyond Weather and the Water Cycle: The Sun: Earth's Primary Energy Source
Extensive article that discusses the first principle of climate science, i.e., that the Sun is the primary energy source for the climate system of the Earth. Presents five concepts for this principle and explains each, providing...
Missouri State University
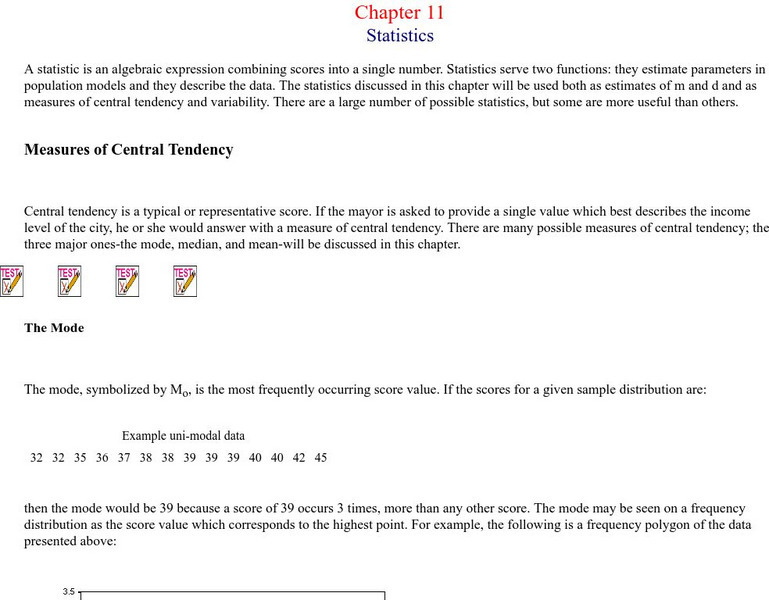
Missouri State University: Introductory Statistics: Statistics
This is an excellent resource on what the science of statistics involves. There are all kinds of definitions, examples, graphs, and charts to learn from. The topics covered include: mode, mean, median, skewed distributions and measures...
Missouri State University
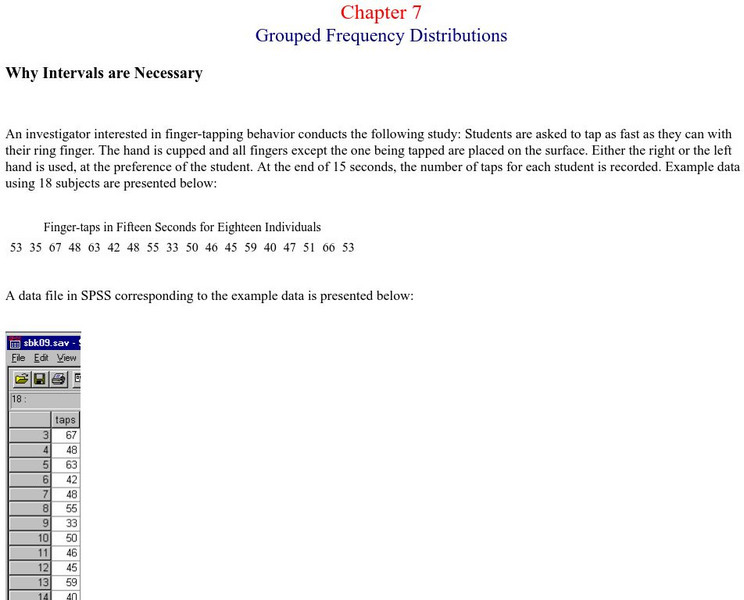
Missouri State Univ.: Introductory Statistics: Grouped Frequency Distributions
An example is provided for the explanation of grouped frequency distributions. Graphs show how to construct histograms and overlapping bell curves, and Excel documents are discussed as being useful here.
TeachEngineering
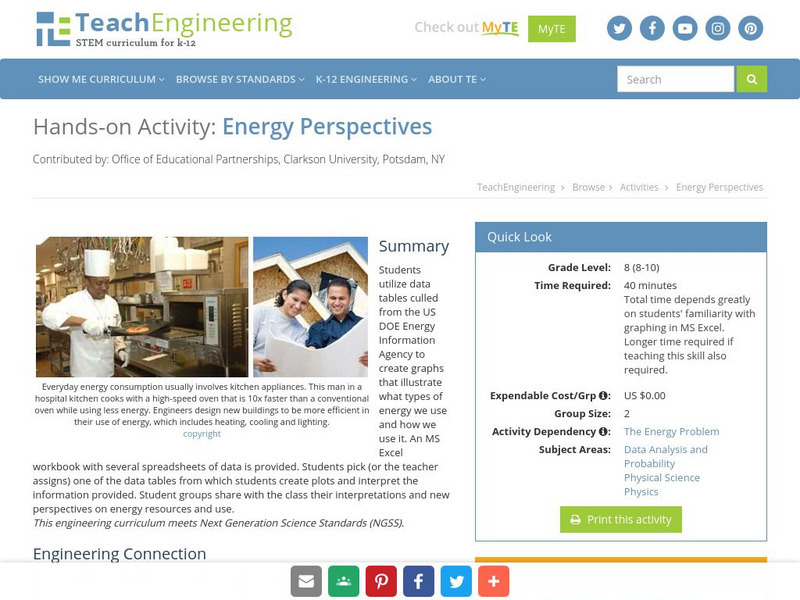
Teach Engineering: Energy Perspectives
Students utilize data tables culled from the US DOE Energy Information Agency to create graphs that illustrate what types of energy we use and how we use it. An MS Excel workbook with several spreadsheets of data is provided. Students...
TeachEngineering
Teach Engineering: Applying Hooke's Law to Cancer Detection
Students explore Hooke's law while working in small groups at their lab benches. They collect displacement data for springs with unknown spring constants, k, by adding various masses of known weight. After exploring Hooke's law and...
TeachEngineering
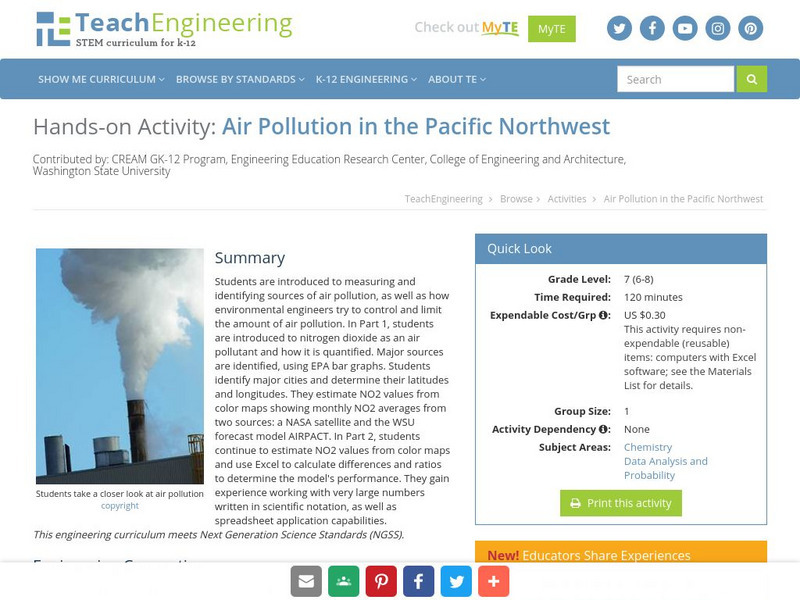
Teach Engineering: Air Pollution in the Pacific Northwest
Students are introduced to measuring and identifying sources of air pollution, as well as how environmental engineers try to control and limit the amount of air pollution. In Part 1, students are introduced to nitrogen dioxide as an air...
TeachEngineering
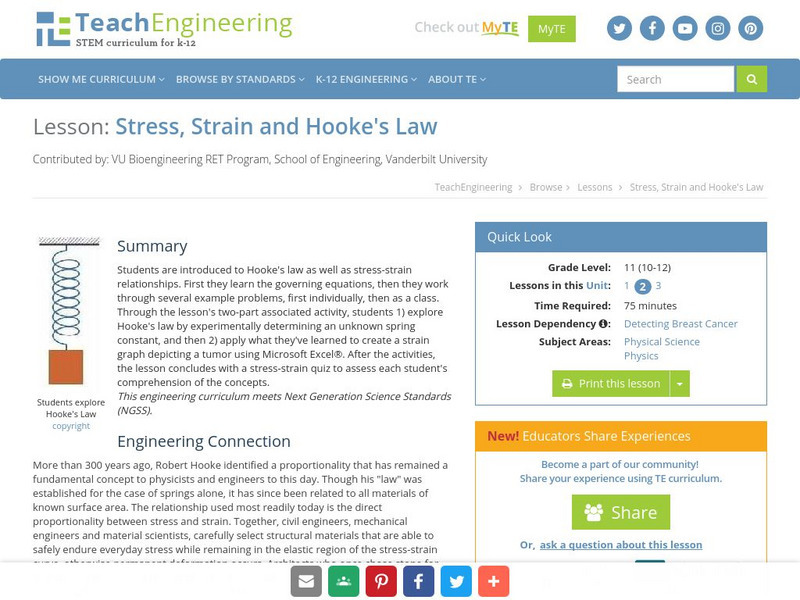
Teach Engineering: Stress, Strain and Hooke's Law
This lesson offers an introduction to Hooke's Law as well as stress-strain relationships. Students will first learn the governing equations. Then students will work through several example problems first individually, then as a class. In...
TeachEngineering
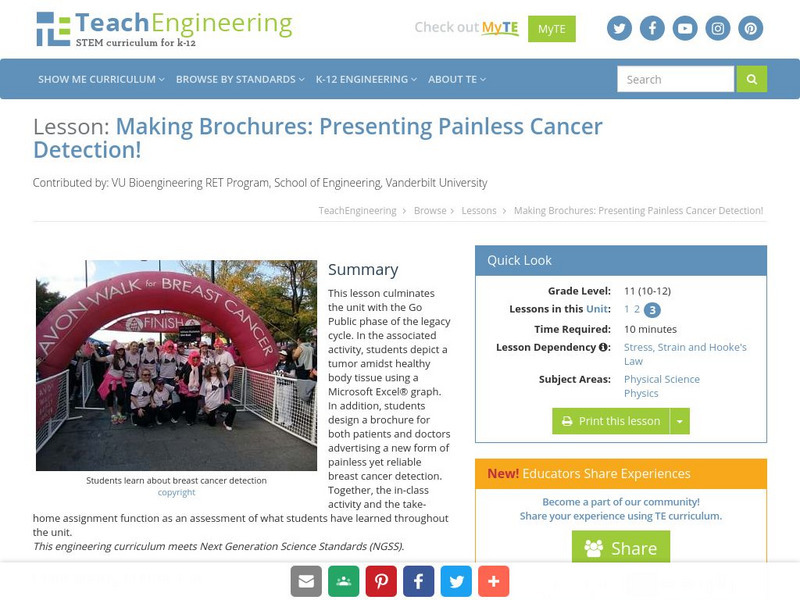
Teach Engineering: Presenting Painless Breast Cancer Detection!
This lesson culminates the unit with the Go Public phase of the legacy cycle. In the associated activity, students must depict a tumor amidst healthy body tissue using a graph in Microsoft Excel. In addition, students will design a...
Other
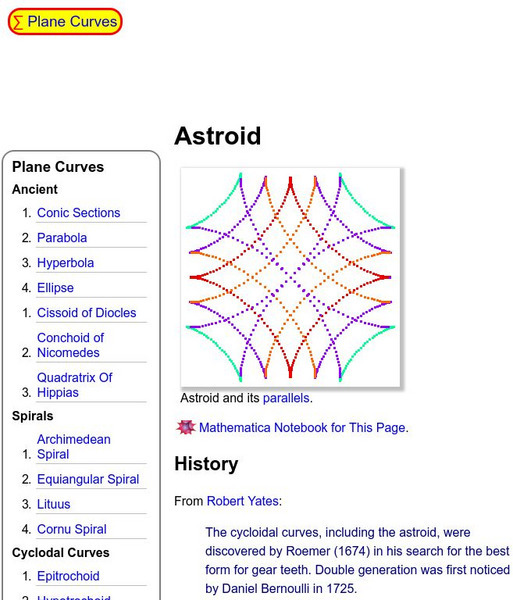
Personal: Astroid
Excellent personal site! Gives the complete history of the astroid and has lots of pictures, graphs, and even videos!
Texas Instruments
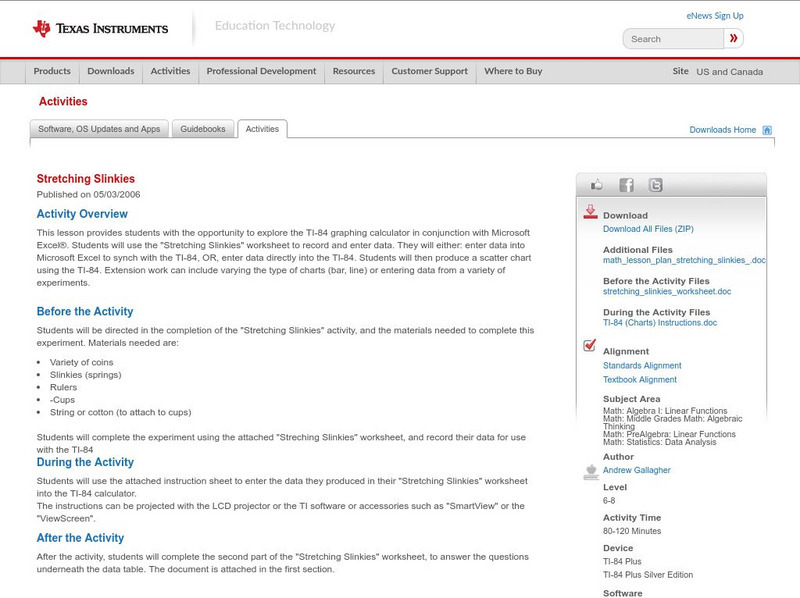
Texas Instruments: Stretching Slinkies
This lesson provides students with the opportunity to explore the TI-84 graphing calculator in conjunction with Microsoft Excel. Students can use the "Stretching Slinkies" worksheet to record and enter data. They will either: enter data...
Food and Agricultural Organization of the United Nations
Faa: Forests and Forestry
This site from the Food and Agriculture Association of the United Nations is an excellent, detailed presentation of survey results about European attitudes towards forests and forestry. Helpful graphs and charts illustrate the survey...
University of Oregon
Magnet Lab: University of Oregon Virtual Laboratory
The collection of interactive physics applets offered by the University of Oregon is an excellent resource for students. The applets are grouped in broad subject areas including astrophysics, energy and environment, mechanics and...
Texas Instruments
Texas Instruments: Piecewise Functions on Ti Interactive
Despite what most of us veiw as an excellent TI InterActive! Help file, my students have a difficult time getting the appropriate graphs after reading it. This is visual directions on how to enter piecewise functions in TI InterActive!...
Science Education Resource Center at Carleton College
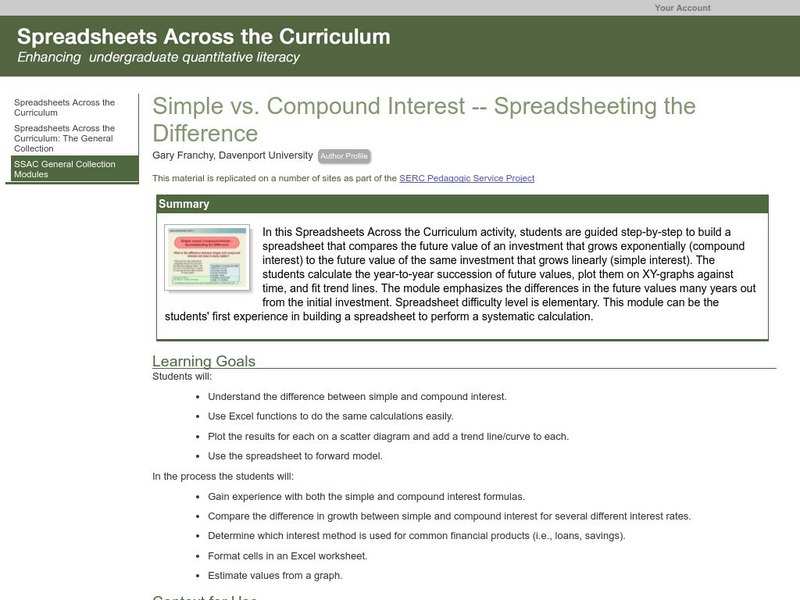
Serc: Simple vs. Compound Interest Spreadsheeting the Difference
A lesson plan that includes a PowerPoint learning module for students. The goal of the lesson is to learn the difference between simple and compound interest and to use the functions in Excel to perform the calculations and graph the data.
Other popular searches
- Circle Graph in Excel
- Excel Graphs and Charts
- Excel Graphs Eye Color
- Free Excel Graphs
- Excel Graphs M&m
- Creating Graphs in Excel
- Creating Excel Graphs
- Scatter Plot Graphs Excel
- Excel Graphs Mm
- Bi Excel Graphs
- Data Graphs on Microsoft Excel
- Making Graphs With Excel






![Wired Math: Organizing Data Grade 7 [Pdf] Activity Wired Math: Organizing Data Grade 7 [Pdf] Activity](https://static.lp.lexp.cloud/images/attachment_defaults/resource/large/FPO-knovation.png)
