Hi, what do you want to do?
Curated OER
Science in Focus: Force and Motion
Students explore force and motion through a series of experiments. In this physics instructional activity, students create and interpret speed graphs. They build an electromagnet and explain the factors affecting its strength.
Curated OER
Fruitvale Extension
Students determine sources and extent of ground water contaminate, apply mathematics to model in real world simulation, and use technology to present results.
Curated OER
Making Connections, Linking Population and the Environment
Students find out that all habitats have a carrying capacity. They explore how the world's human population has grown markedly in the 20th century, and that humans impact environmental health. Students investigate that people can and...
Curated OER
American History Through Architectural Masterpieces: Monticello
Students examine the life of Thomas Jefferson, explore great American landmark Monticello, discover relationships between climate, geographical factors, and time as to what kind of architecture was used, conduct research online, write a...
Curated OER
Total English: Two-Part Expressions Crossword
For this two-part expressions crossword puzzle worksheet, students practice key vocabulary as they read the 11 clues to correctly fill in the word puzzle. Students also write 4 sentences.
Curated OER
Technology - Data Collection
Students collect and analyze data from the United States Census Bureau. Using spreadsheet technology, students explore their results and make preductions about income groups. Students compute the mean, median and mode. They create...
Curated OER
Eagle-Eyed
Students study the eyesight of eagles. They discuss raptors and their eyesight and compare it to their own. They measure how far away they can see a small object and its distance. They calculate the eyesight to measure an eagle's...
Curated OER
Global Water Cycle & Heat Flow
Students experiment to discover how different variables affect the water cycle. They do hat flow experiments and construct a computer heat flow model.
Curated OER
How Much Is There To Eat?
Tenth graders compare the relationship of food production and population in India with the southern regions of the United States.
Curated OER
Mapping It Out
Fourth graders examine various aspects of the environment of Utah. In groups, they create four maps of Utah, based on temperature, precipitation and elevation. To end the instructional activity, they are asked a question as a group and...
Other
Edte.ch: Maths Maps
Maths Maps is a collaborative project where participants use Google maps to choose a location within one of the cities highlighted, then create a Math problem about the site. The problems are marked on the map with various colors...
Montgomery CountyPublic Schools
Mcps: Multiple Representations of Slope Intercept
A Grade 8 Math teacher describes how she uses Excel and Word as tools to provide multiple representations of slope intercept for a UDL summative project in Algebra.
Duke University
Duke University: Web Feats Ii: Free Donuts
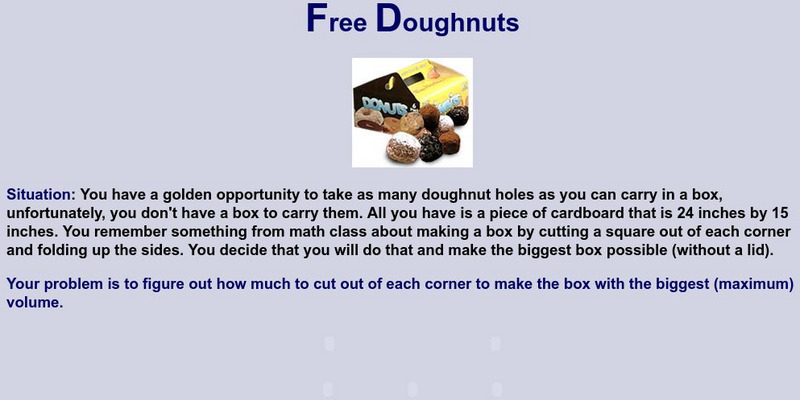
This is an excellent interactive site which walks the student through the process of finding the maximum volume for a box given the length and width of a piece of cardboard. The site poses numerous multiple choice questions for the...


