College Board
Power in Tests of Significance
Test your knowledge of tests of significance. A curriculum model for AP® Statistics describes and defines power in terms of tests of significance. It also provides two classroom activities designed to investigate power and how it relates...
Calvin Crest Outdoor School
Survival
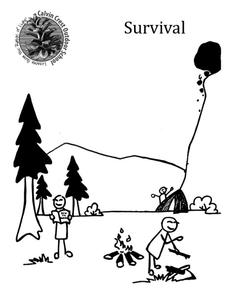
Equip young campers with important survival knowledge with a set of engaging lessons. Teammates work together to complete three outdoor activities, which include building a shelter, starting a campfire, and finding directions in the...
Curated OER
The Old Man and the Sea: Problematic Situations
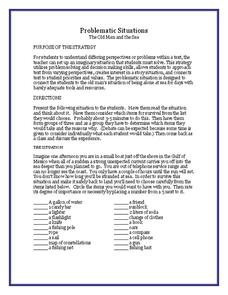
Bring the drama of Ernest Hemingway's The Old Man and the Sea to class with a fun role-playing activity. Given a list of survival items, readers decide which items would be the most necessary for an adventure like...
EngageNY
Summarizing a Data Distribution by Describing Center, Variability, and Shape
Put those numbers to work by completing a statistical study! Pupils finish the last two steps in a statistical study by summarizing data with displays and numerical summaries. Individuals use the summaries to answer the statistical...
Radford University
A Change in the Weather
Explore the power of mathematics through this two-week statistics unit. Pupils learn about several climate-related issues and complete surveys that communicate their perceptions. They graph both univariate and bivariate data and use...
Curated OER
Who Does the Lottery Benefit?
Young scholars investigate the pros and cons of the lottery. In this algebra lesson, students use the formulas for permutation and combination to test their arguments about the lottery. They collect data about their argument and plot it...
Curated OER
Properties of Logarithms
Students explore the concept of logarithms. In this logarithms lesson, students graph logarithms on their Ti-Nspire calculator. Students describe the shapes of their graphs by identifying slope, y-intercepts, and roots. ...
Curated OER
The Sexton and the Compass
Students evaluate how movement patterns create and affect interdependence. They analyze the interactions within and between regions and engage in artistic inquiry, exploration, and discovery in collaboration with others. They design...
Curated OER
Computing Mean, Mode and Median
Ninth graders collect data on basketball player's heights and determine the mean, median, and mode for the data.
Curated OER
Food and Food Groups
Eighth graders research the importance of diet and its relationship to disease. They examine their own attitudes about the foods they eat.
Curated OER
Looking at Conflict
In this conflict worksheet, students answer a set of 6 questions related to conflict. Site has links to additional resources.
Columbia University
Columbia University: Expected Value Pdf
A PDF explaining and giving examples to show how the expected value of a random variable indicates its weighted average.
Khan Academy
Khan Academy: Making Decisions With Expected Values
Calculate expected values and then use them to make decisions. Students receive immediate feedback and have the opportunity to try questions repeatedly, watch a video or receive hints.
Khan Academy
Khan Academy: Expected Value With Calculated Probabilities
Find expected value based on calculated probabilities. Students receive immediate feedback and have the opportunity to try questions repeatedly, watch a video or receive hints.
Khan Academy
Khan Academy: Expected Value With Empirical Probabilities
Find expected value based on empirical probabilities. Students receive immediate feedback and have the opportunity to try questions repeatedly, watch a video or receive hints.
Texas Instruments
Texas Instruments: Numb3 Rs: Expected Value
Based off of the hit television show NUMB3RS, this lesson attempts to explain the betting system at horse tracks by having students vie for parcels of land on their calculators. Because the land boundaries are unknown until the finale of...
Khan Academy
Khan Academy: Discrete Random Variables: Expected Value
Compute the expected value given a set of outcomes, probabilities, and payoffs. Students receive immediate feedback and have the opportunity to try questions repeatedly or receive hints.
Khan Academy
Khan Academy: Mean (Expected Value) of a Discrete Random Variable Practice
A practice word problem asking learners to calculate the mean of B in a probability chart.
Texas Instruments
Texas Instruments: Probability: Pairs of Events and Expected Values
This set of questions pertains to probability: pairs of events, mutually exclusive events, complementary events, expected values, independent events, and conditional probability. Solutions and explanations are included.
NC State University
Nc State University: 4.2 (Cont.) Expected Value of a Discrete Random Variable
A PowerPoint explaining and showing examples of how to measure the mean of the values of a random variable.
Sophia Learning
Sophia: Introduction to Probability
Introduction to Probability is a resource that provides assessment and teacher tutorials that focus on mathematic concepts such as probability, outcomes, events, probability distribution, laws, values and odd.
Texas Instruments
Texas Instruments: Numb3 Rs: Not So Great Expectations
Based off of the hit television show NUMB3RS, this lesson exposes students to the concept of expected values (or expected outcomes). The method for computing the expectation is explained, and then many examples are given for students to...
Interactive Mathematics
Interactive Mathematics: Probability Distribution
The concept of random variables is the focus of this lesson, including definitions of discrete and continuous random variables. Discussions on discrete probability distribution and density function are included, along with expected value...
Illustrative Mathematics
Illustrative Mathematics: S Md.2 Bob's Bagel Shop
The purpose of this task is to assess a student's ability to compute and interpret an expected value. Notice that interpreting expected value requires thinking in terms of a long-run average. Students will help Bob the bagel man find the...

