Curated OER
M & M Candy: I Want Green
Eighth graders use colored candy pieces (such as M & M's) to compare mathematical expectations and experimental probability. They pick pieces of candy randomly, and graph their results. This classic lesson never fails to engage...
Curated OER
Alternative Energy Part II - Lesson Eight of Eight - Energy Conversion and Propulsion
Students investigate the results of different propulsion methods. In this propulsion lesson, students measure the distance a test toy car goes using different types of propulsion. They record the distances in data tables before...
Curated OER
Consistent Circles
Students create a design of a circle. In this geometry lesson, students identify the measure of the diameter and radius of a circle. They graph and analyze their collected data and write equations based on direct variation.
Curated OER
Trouble in the Troposphere
Students Use data sets from MY NASA DATA to produce graphs comparing monthly and yearly ozone averages of several U.S. cities. They analyze and evaluate the data and predict trends based on the data. In addition, they discuss and...
Curated OER
Let's Take a Chance!
Students investigate probability and the chance of an even happening. In this algebra activity, students incorporate their knowledge of probability to solve problems and relate it to the real world. They learn to make decisions based on...
Curated OER
Chew on This
Eighth graders explore and demonstrate the seven steps of the scientific method. They predict how much sugar is in chewing gum and test, analyze, and calculate the sugar content of gum.
Curated OER
A RealSim Surface Look at Descriptive Statistics
Students explore the concepts of mean and variance. They observe properties of materials to their basic atomic or molecular structure. Students use spreadsheet software to record, tabulate and analyze collected information.
California Academy of Science
How Big is Big?
In a math or life science class, "mini-me" models are created with cardstock to reflect a 1:10 scale of young scholars' bodies. Learners measure each others' heights with meter sticks, and then reduce the size by 10. After this exercise,...
Teach Engineering
About Accuracy and Approximation
How accurate are robots? Groups draw lines by moving robots backwards and forwards by one rotation of the wheels. Using the appropriate formula, they determine the percent error in the length of the lines in relation to the calculated...
Shodor Education Foundation
Playing with Probability
Review basic probability concepts with your class using different-colored marbles in a bag. Then pair up learners and have them play a cool online interactive game in which they race miniature cars using the roll of a die or two. The...
Teach Engineering
Physics Tug of War
Slide books with a little assistance from Newton. Using books, groups create a demonstration of Newton's Second Law of motion. Pupils compare the distance traveled by one and two books when they apply a force to them.
Curated OER
Which Muscles?- Olympic Learn and Play Sports
In this math, science, and physical education worksheet, students brainstorm and study about the muscles that are used while participating in different Olympic sports. They color the muscle groups of the body by follow the directions...
Curated OER
Race the Track! Design Challenge
Students use the design process to investigate physical science. In this force and motion lesson, design a track to achieve a specified outcome. Students complete additional experiments with speed and distance. Students recognize the...
Curated OER
Do You Feel Lucky?
Students explore probability by using games based on probable outcomes of events. They name all of the possible outcomes of an event and express the likelihood of such an event occurring.
Curated OER
What You See Is Not Always What You Get!
Young scholars estimate and calculate the distance of a shape. In this algebra lesson, students differentiate between a horizontal distance and it's reflected image. They measure the reflection and the point starting at the eye of the...
Curated OER
Charting a New Course
Students calculate the distance they will travel. In this geometry lesson plan, students use the TI and CBL system to make calculation of a certain path. They explore geography by calculating distances between different areas as it...
Shodor Education Foundation
Tree Diagrams and Probability
Aspiring statisticians create tree diagrams and figure probabilities of events based on those diagrams. They practice adding and multiplying fractions and explain complementary probabilities. Students use computers activities to make...
Curated OER
The Swinging Pendulum
Students observe a pendulum and graph their observation. In this algebra lesson, students use the TI calcualtor to graph the motion the pendulum makes. They analyze the graph and make predictions.
Curated OER
Applied Science-Science and Math (2A) Post Lab
Second graders create a graph about TV watching. In this bar graph lesson, 2nd graders make a hypothesis about how much TV 2nd graders watch per week. They record their TV watching for a week and bring it to school to create a class graph.
Curated OER
Mitosis And the Cell Cycle
Students determine the approximate time a cell spends in each phase of mitosis by counting cells in each phase from a prepared slide. They use a few simple calculations to estimate how long cells spend in each cycle in the body.
Curated OER
Cover and Boarders
Students find the area and perimeter of rectangular figures. They use this information to find patterns and discover relationships between area and perimeter. Students apply and explain formulas relating to perimeter, area, and volume.
Curated OER
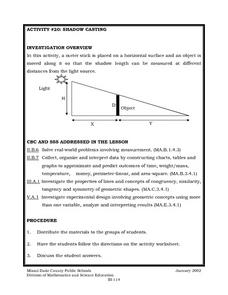
Shadow Casting
Eighth graders use a meter stick that is placed on a horizontal surface and an object is moved along it so that the shadow length can be measured at different distances from the light source. They solve real-world problems involving...
Curated OER
Designing Detectives
Third graders explore the idea of formulating a hypothesis and designing an experiment to test the hypothesis.
Curated OER
Effects of Environment on Memory
High schoolers explore the effect that environment has on memory. They analyze their own study habits and draw conclusions about their work behaviors. Baseline capacity is established for the subjects' ability to memorize an increasing...


