Hi, what do you want to do?
Curated OER
Battery Power
Sixth graders examine how much energy they use in the form of battery power. They examine the cost of using regular vs. rechargeable batteries and examine the effect on the environment of the two types of batteries. They discover that...
PBS
Toothpicks and Transformations
Students investigate quadratic functions using geometric toothpick designs. They review transformations of quadratic functions-vertical and horizontal shifts, and stretches and shrinks. Students match the symbolic form of the function to...
Curated OER
Properties of Logarithms
Students explore the concept of logarithms. In this logarithms activity, students discuss the logarithm properties. Students use linear functions as a basis to develop the logarithm properites by substituting log b and log a...
NOAA
The Oceanographic Yo-yo
How does chemistry help deep-sea explorers? Part four of a five-part series of lessons from aboard the Okeanos Explorer introduces middle school scientists to technologies used in ocean exploration. Groups work together to analyze data...
Curated OER
Analyzing Graphs and Data
Students collect and analyze data. In this statistics lesson plan, students graph their data and make inferences from the collected data. They display their data using graphs, bar graphs, circles graphs and Venn diagrams.
Curated OER
Education for Global Peace
Students survey the class and graph the results. In this graphing and data collection lesson plan, students conduct a survey to see where their shirts were produced. Individuals use software to graph the results and create a written...
Curated OER
Graph Made Easy: Post Test
In this graphs activity, students answer multiple choice questions about line graphs and bar graphs. Students answer 10 questions total.
Curated OER
The Environment and Interactions of Living Organisms
Students study the environment and interactions of living organisms. They identify abiotic and biotic factors and create a foldable and vocabulary cards. They create a poster illustrating soil and watch a video to study symbiosis.
Curated OER
Graphing Linear Equations
Students graph linear equations. In this algebra instructional activity, students investigate the price of tolls in different states and create a graph. They analyze their graph and draw conclusions.
Curated OER
Quadratic Modeling Of Canada's Baby Boom
High schoolers model quadratic equations. In this algebra lesson, students are given data to graph using a function. They investigate vertex and transformation of quadratic functions.
Curated OER
Modeling With Quadratics
Students investigate quadratics through word problems. In this algebra lesson, students models the number of registered males in apprenticeship programs. They investigate the transformation of quadratic function on a coordinate plane.
Curated OER
Finding Equations
Students make equations from everyday data. They create a graph from the equations. Students predict and analyze the results. Students complete the second scenario on their own and turn in their handout.
Curated OER
The Hot Dog Stand - An Annual Report
Students run a computer simulation and collect data as they work and use the data to create an annual report for their business. It is desirable for students to do this project individually, but it could be done as a class using a large...
Curated OER
Investigating the Soil
Students explore the Earth's crust by researching pH levels and acidity. In this environmental safety lesson, students identify the pros and cons of acidity within soil and how it affects plants. Students collaborate in a pH level...
Math Is Fun
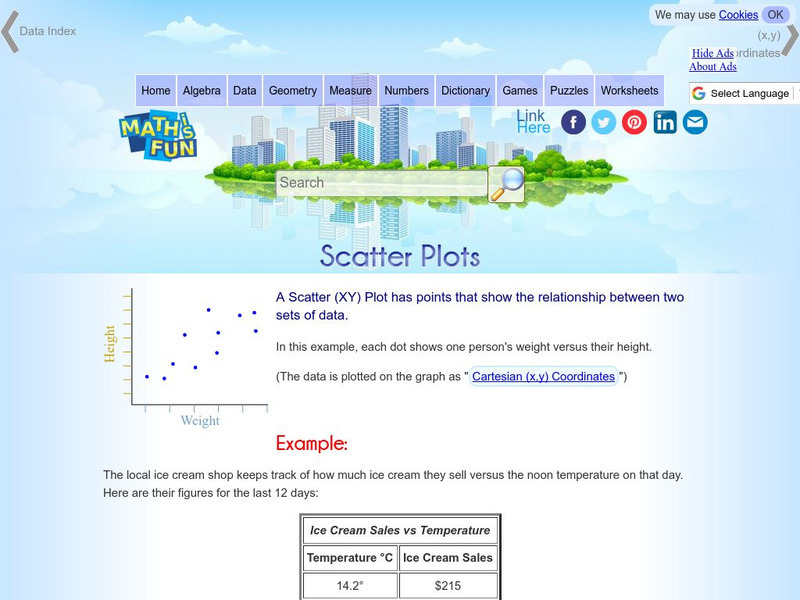
Math Is Fun: Scatter Plots
Explains, with examples, what scatter plots are and how to interpret the data. Discusses trends, interpolation and extrapolation, and correlation. Includes a set of practice questions.
Math Planet
Math Planet: Scatter Plots and Linear Models
Provides examples and a video lesson that explains scatter plots.
Khan Academy
Khan Academy: Describing Trends in Scatter Plots
Practice making sense of trends in scatter plots. That is, explain what trends mean in terms of real-world quantities. Students receive immediate feedback and have the opportunity to try questions repeatedly, watch a video, or receive...
Varsity Tutors
Varsity Tutors: Hotmath: Algebra Review: Scatter Plots
Find a quick, concise explanation of what a scatter plot is. Several examples are given and clearly explained.
Iowa State University
Iowa State Univ: Plotting Scatter Plot in X Gobi
Site explains how the XGobi computer program can be used to plot data in a scatter plot.
Varsity Tutors
Varsity Tutors: Hotmath: Algebra Review: Line Plot
Find a quick, concise explanation of a line plot. An example is given and clearly explained.
Texas Instruments
Texas Instruments: Mc Dougal Littell Algebra 1: Perform Linear Regression
Students can use the TI-84 Plus family to enter data, do a scatter plot and find the line of best fit and explain how they could use it to predict future values.
Illustrative Mathematics
Illustrative Mathematics: 8.sp.1 Hand Span and Height
This task looks at a possible relationship between height and hand size. Students collect data from classmates, make a scatter plot, and explain the relationship as linear or nonlinear. Aligns with 8.SP.A.1.
York University
York Univ.: Statistical Graphics for Multivariate Data
Provides several graphical representations of multivariate data. This paper explains the graphs such as the scatter plot and several other graphs as well. Site is presented in notes and outline format.
PBS
Pbs Teachers: Sports and Math: Will Women Athletes Ever Catch and Surpass
Explore, explain and make conclusions based on graphs of scatter plots of the Olympic records for men and women in the same event over the same years. Plot x- and y-values, and create linear equations from the data.


