Curated OER
Extending the Definitions of Exponents, Variation 2
Introduce the concept of exponential functions with an activity that extends the definition of exponents to include rational values. Start with a doubling function at integer values of time, then expand table to include frational time...
Achieve
Ivy Smith Grows Up
Babies grow at an incredible rate! Demonstrate how to model growth using a linear function. Learners build the function from two data points, and then use the function to make predictions.
Curated OER
World Population Study
Students explore an exponential relationship and how it relates to human population growth and the current global population crisis. They graph both exponential and linear information.
Curated OER
WORLD POPULATION STUDY
Students explore an exponential relationship and how it relates to human population growth and the current global population crisis.
Curated OER
An Introduction to Functions
Young scholars investigate the growth and decay of an exponential function. In this algebra instructional activity, students apply properties of exponent solve problems. They identify any patterns they see in the graphs.
Curated OER
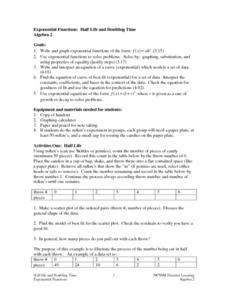
Exponential Functions: Half Life and Doubling Time
High schoolers investigate the concept of exponential functions and how they increase in size over time. They simplify the functions in order to find the solutions that are possible and perform analysis of the curved line that is...
Achieve
Spread of Disease
Viruses can spread like wildfire, and mathematics can model the speed of infection. Given a function, scholars analyze it to describe the spread of a disease within a stadium. Learners find the initial number infected and the maximum...
Curated OER
Population Models and Qualitative Analysis
In this quantitative analysis worksheet, students explore the limits of a rate equation. They use quantitative analysis methods to determine the differential, plot graphs of their values, and describe the relationships between the...
Curated OER
The Right Angle
In this algebra learning exercise, 11th graders solve word problems creating a right triangle. Students determine the point and direction this turn of ninety degrees occurs. There are 4 questions with an answer key.
Curated OER
Means of Growth
Students collect and graph data. In this statistics lesson, students analyze their plotted data using a scatter plot. They identify lines as having positive, negative or no correlation.
Curated OER
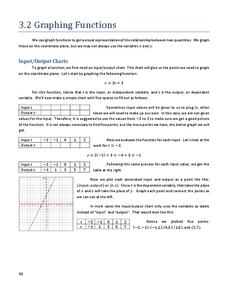
Graphing Functions
In this graphing functions worksheet, students write functions in logarithmic and exponential forms. They evaluate logarithms and determine the inverse of a function. Students graph functions. This six-page worksheet contains 20...
Curated OER
Modeling Natural Disaster with Mathematical Functions
Ninth graders investigate the functional relationship of different environmental phenomena. In this math lesson, 9th graders create models of various natural disasters. They use logarithmic and exponential functions to interpret...
Mathematics Vision Project
Module 3: Polynomial Functions
An informative module highlights eight polynomial concepts. Learners work with polynomial functions, expressions, and equations through graphing, simplifying, and solving.
Curated OER
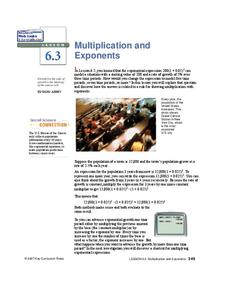
Multiplication and Exponents
Students write values as both standard and exponential forms. In this exponential form lesson, students solve multiplication of exponents problems. Both application and drill and practice formats are presented.
Curated OER
Function Tables
Students practice representing problems found in the real world in terms that can be translated into mathematical expressions. The situations are represented in tables and graphs by students.
Curated OER
Save Your Change
Learners solve problems involving exponential, logarithmic, and scientific notations. Using calculators, students explore investment problems. They use a formula and logarithms to determine the years to earn a particular income, figure...
Mathematics Vision Project
Quadratic Equations
Through a variety of physical and theoretical situations, learners are led through the development of some of the deepest concepts in high school mathematics. Complex numbers, the fundamental theorem of algebra and rational exponents...
Mathalicious
New-tritional Info
Burning off a Big Mac® doesn't seem like a big feat until you calculate the minutes of exercise necessary to break even. Young mathematicians look at different menu items in relation to different body weights and exercises to calculate...
Google
The Law of Large Numbers and Probability
Learners investigate why theoretical probability doesn't always match reality. The activity involves using Python 2.7 (or Sage) to set up a Bernoulli Trial. It also involves setting up a spreadsheet to simulate the Birthday Paradox....
Curated OER
Oodles of Poodles
Students solve equations by graphing. In this algebra lesson, students differentiate between functions and relations. They use the TI to graph their equation and analyze the graph.
Curated OER
Count The Letters
Students perform activities involving ratios, proportions and percents. Given a newspaper article, groups of students count the number of letters in a given area. They use calculators and data collected to construct a pie chart and bar...
Curated OER
Graphing the Population Explosion of Weeds
Students are introduced to the seed cycle and draw the specific steps. In groups, they identify the human barriers to the spreading of weeds. After calculating the rate of spreading of the Yellowstar Thistle, they create graphs to see a...
Curated OER
Calculus
Students make an inquiry with the aid of technology into the concept of functions. The emphasis of the lesson is on the interplay between the geometric and analytic information.
Curated OER
Introduction to Graphical Representation of Data Sets in Connection with Nuclear Decay
Young scholars record data, make observations, and share in experimentation and discussion of numerical experiments.


