Curated OER
How Alike Are We?
Fourth graders find the range, mode, median, and mean for each of the data sets (height and shoe size). They discuss which measure of central tendency for each data set best represents the class and why. Students graph the shoe size and...
Curated OER
Human Number Line
Fourth graders become aware and comprehend number relationships among those numbers most commonly found in geometric applications. They work in groups, 4th graders arrange themselves in order form the least to the greatest number in...
Curated OER
Soil Stories
Tenth graders collect and analyze soil samples and extrapolate the characteristics needed to support different types of plant life. They research different types of prairie soil and how it supports plant and animal life.
Curated OER
Fire Wars
Your class can practice collecting and analyzing data. They extrapolate information and derive data from fire season statistics. They also choose the most appropriate format to display collected data.
Curated OER
Life in the Freezer
In this global warming worksheet, climatologists examine a few possible results of climate change. There is no specific reading from which learners extrapolate the information needed to answer the questions, so you will need to preface...
Curated OER
Goblin Market Theme of Sex
Learners will read then analyze the story "Goblin Market" then discuss themes of sex and lost virginity. There are 5 questions and a series related links to help them take a critical look at an interesting children's story. This story...
Curated OER
Dating Practices
Students interpolate, extrapolate, and make predictions from given information. They present results and conclusions from given data using basic statistics. Pupils create a survey from a critical question and decide which sampling...
Curated OER
History Repeats Itself
Twelfth graders research historical turning points, gather-data, and extrapolate possible alternate outcomes. They work individually to choose one historical event from Attachment D, Historical Turning Points. Students complete either...
Curated OER
Reflecting on Reflectivity
Students plan and construct a "mini-lab" to measure the reflectivity of different earth surfaces. They measure reflectivity of materials, including ice, soil, rocks, etc., and then extrapolate from what they have learned to consider the...
Curated OER
Climographs
Students identify trends and characteristics of climate zones and specific places within. Then, they graph annual climate trends (primarily Temperature and Precipitation) and create, interpret and extrapolate information based on...
Curated OER
Line of best fit
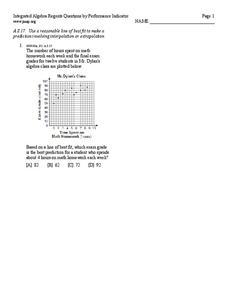
In this Algebra I/Algebra II worksheet, young scholars determine the line of best fit for a scatter plot and use the information to make predictions involving interpolation or extrapolation. The one page worksheet contains one multiple...
Curated OER
Using the Balance
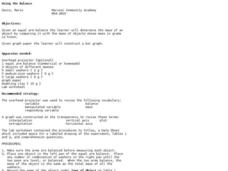
Students determine the mass of various objects. In this integrated math and science lesson, students use an arm balance to compare a known object to a combination of washers with a fixed weight. Students record data, construct a bar...
Curated OER
Volumes of Solids
In this volume worksheet, students observe diagrams and extrapolate the correct items to plug into a formula for volume. They find the volume of triangular prisms, cylinders, cones, rectangular prisms, and rectangular pyramids. Four of...
Curated OER
Graph a Situation by Making a Table
Students graph scenarios values by making a table. In this algebra lesson, students rewrite word problems using algebraic symbols. They make a table of the data, make a graph and analyze the data to extrapolate.
Curated OER
More graphing situations by making a table
Students make a table and graph plotting points. For this algebra lesson, students graph linear equations on a coordinate plane. They calculate the rate of change and analyze the graph for extrapolation.
Curated OER
The Collection
Reading informational text can be fun and interesting when the topic is right. Unfortunately, this topic may not be all that interesting or right for every learner. They boost reading comprehension and the ability to extrapolate...
Curated OER
Rapid Ecological Assessment
Students conduct an ecological assessment of a small area on school property and apply findings to the greater area. They inventory the plant and animal population of a sample area and extrapolate results to a larger area.
Curated OER
What Can We Learn from Primary-Source Documents? Lesson 2
Students extrapolate information from primary-source documents. They read and research to create a whole-class timeline of events leading up to 1867 and Confederation.
Curated OER
Linear Patterns in Data
Eighth graders extend their learning of graphing linear equations and are introduced to connecting patterns in tables and graphs to represent algebraic representations. They then determine patterns and extrapolate information from these...
Curated OER
Numerical Analysis: Piecewise Polynomial Interpolation
In this interpolation worksheet, students use a linear interpolating polynomial and then describe the extrapolated value of the function. This four-page worksheet contains ten problems.
Curated OER
Absolute Zero Lab
In this absolute zero worksheet, students experiment with a closed-end syringe and a ice bath and boiling water. They record volumes of gases in the syringe as well as temperatures of the water and they plot their experimental data. They...
Curated OER
Point Graphs
Students experiment with point graphs. In this math lesson, students are divided into groups and perform an experiment to see how high a ball bounces, recording their results on a point graph. Students then answer provided questions.
Curated OER
Multiplying Fractions
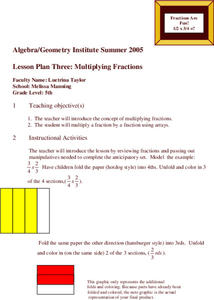
Fifth graders explore the multiplication of fractions. Using paper folds, 5th graders observe multiplying by a fraction. They extrapolate multiplication problems from studying a written graphic.
Curated OER
Population Dilemma
Ninth graders explore population growth. In this Algebra I activity, 9th graders conduct an experiment simulating population growth. Students create a model and relate the results to a real-world situation. Students create a scatter...


