Curated OER
Extraordinary Extrapolation
Students study how scientists have estimated the maximum height to which trees can grow, and assess the reliability of interpolation and extrapolation techniques by making predictions with particular data sets and analyzing accuracy of...
Curated OER
Numerical Analysis: Polynomial Interpolation
In this polynomial activity, students identify the interpolated and extrapolated value of given equations. This four-page activity contains approximately ten problems. Explanations and examples are provided.
Curated OER
Numerical Analysis: Piecewise Polynomial Interpolation
In this interpolation worksheet, students use a linear interpolating polynomial and then describe the extrapolated value of the function. This four-page worksheet contains ten problems.
Curated OER
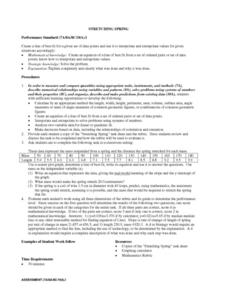
STRETCHING SPRING
Young scholars calculate the length, width, height, perimeter, area, volume, surface area, angle measures or sums of angle measures of common geometric figures. They create an equation of a line of best fit from a set of ordered...
Curated OER
Dating Practices
Students interpolate, extrapolate, and make predictions from given information. They present results and conclusions from given data using basic statistics. Pupils create a survey from a critical question and decide which sampling...
Curated OER
Around the Clock
Middle schoolers discover the relationship between the circumference of a circle and its diameter. They find the length of an arc of a circle.Students use estimation strategies in real-world applications to predict results (i.e.,...
Curated OER
Point Graphs
Students experiment with point graphs. In this math lesson, students are divided into groups and perform an experiment to see how high a ball bounces, recording their results on a point graph. Students then answer provided questions.
Curated OER
How Alike Are We?
Fourth graders find the range, mode, median, and mean for each of the data sets (height and shoe size). They discuss which measure of central tendency for each data set best represents the class and why. Students graph the shoe size and...
Curated OER
Line of best fit
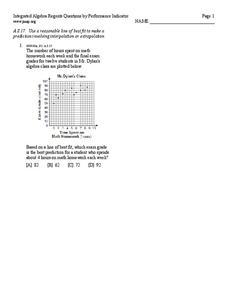
In this Algebra I/Algebra II worksheet, young scholars determine the line of best fit for a scatter plot and use the information to make predictions involving interpolation or extrapolation. The one page worksheet contains one multiple...
Curated OER
Using the Balance
Students determine the mass of various objects. In this integrated math and science lesson, students use an arm balance to compare a known object to a combination of washers with a fixed weight. Students record data, construct a bar...
Curated OER
Linear Patterns in Data
Eighth graders extend their learning of graphing linear equations and are introduced to connecting patterns in tables and graphs to represent algebraic representations. They then determine patterns and extrapolate information from these...
Curated OER
Track's Slippery Slope
Learners graph data of sports figure running time using x-axis y-axis to find slope of trend line, mathematically find the interpolated and extrapolated values for data points. Using the information they make predictions.
Kenan Fellows
How Does an Unhealthy Diet Influence our Health and Well-Being?
You are what you eat, or so they say! After surveying family and friends on a week of eating habits, learners analyze the data for patterns. They compare different variables such as fats and cost, fats and calories, or fats and LDLs.
Curated OER
Count on Me
Fourth graders use inductive reasoning to find algebraic patterns in geometric figures. They use technology (i.e., calculators, computers) and manipulatives to discover number patterns involving geometric concepts. They solve concrete...
Curated OER
A Special Relationship
Students discover the relationships of the lengths of the sides of right triangles and right triangles using a series of drawings on dot paper. They investigate and solve problems of standard (customary and metric units) and non-standard...
Curated OER
Quadratic Functions and Stopping Distance
Learners solve quadratic equations. In this algebra lesson, students factor and graph quadratic functions. they use the properties of quadratics to calculate the distance.
Curated OER
Modeling Natural Disaster with Mathematical Functions
Ninth graders investigate the functional relationship of different environmental phenomena. In this math lesson, 9th graders create models of various natural disasters. They use logarithmic and exponential functions to interpret...
Curated OER
Survey Project
Eighth graders create a website using FrontPage. They use inserted forms to collect survey information and use Microsoft Excel and MS Word to create a presentation of the survey and the results.
Curated OER
Investigating Linear Equations Using Graphing Calculator
Students investigate linear equations using the Ti-Calculator. In this algebra activity, students graph lines and identify the different quadrants on a coordinate plane. They identify ordered pairs used to plot lines.
Curated OER
How Do They Relate? Linear Relationship
Students collect information and use a line to represent it. In this algebra lesson, students investigate real world data to see if it makes a line. They graph the line comparing the relationship of the x axis with that of the y axis.
Curated OER
Missed The Boat
Students complete time and distance problems. Using appropriate problem solving strategies, students determine when a helicopter will catch a cruise ship. Students write a summary of their solution process. They complete a graph to...
Curated OER
Lining Up Data
High schoolers examine the concept of function and make models of data and predictions based on that data.
Curated OER
Perimeters, Patterns, and Conjectures
Students discover patterns and write conjectures relating to perimeters and polygons. Working in cooperative learning groups, they use manipulatives and graphic organizers to solve problems then answer a series of questions in which they...


