Mathed Up!
Pie Charts
Representing data is as easy as pie. Class members construct pie charts given a frequency table. Individuals then determine the size of the angles needed for each sector and interpret the size of sectors within the context of frequency....
Curated OER
Multiplication Charts
This resource consists of a series of three fill in the blank multiplication charts each of which have different missing information to be plugged in. Students need to fill in a total of 90 numbers over the course of these three pages....
Balanced Assessment
Scale Charts
Develop scales using tables. Pupils complete charts to show equivalent scale factors before using the completed tables to determine the sizes of scale drawings. They finish the lesson and demonstrate their understanding by completing a...
Mathed Up!
Tallys and Charts
After watching a brief instructional video, young mathematicians are put to the test. By completing and reading frequency tables, tally charts, and bar graphs, individuals show their understanding of how to interpret data.
Curated OER
Fill in the Graphs
For this graphing information activity worksheet, students use the 6 provided clues to appropriately fill in the blanks in a pie chart.
Curriculum Corner
Back to School Math and Literacy Centers
From filling in the missing number to filling in the missing letter; to writing fluency sentences to skip counting and matching, a complete set of back to school math a literacy centers will not disappoint. Use these activities...
Curated OER
Hundreds Charts
In this hundreds charts worksheet, students fill in the hundreds charts that are completely blank, have the 5's filled in, and have the 10's filled in. Students have 3 charts to fill in.
San Jose Unified School District
Multiplication Chart
Looking to support your young mathematicians with mastering their multiplication facts? Then this set of multiplication charts is a great place to start, allowing children to visualize the the relationships between factors and multiples.
Curated OER
Write the Missing Numbers
Which numbers are missing on these hundreds charts? Beginning counters fill in the blank squares in a set of hundreds charts. One simply has the numbers 1 and 100, while the others are missing every other number, only even numbers, or...
Curated OER
Four Algebraic Proof Charts
In this proof chart instructional activity, learners are given an equation and asked to solve for the unknown and to justify the steps by filling in the proof using math properties. The instructional activity contains four problems...
Curated OER
Working Out The Workout: Chart Activity
In this chart worksheet, students complete one column in a chart to determine total hours of exercise time, then use the chart to complete 4 additional questions.
Santa Barbara City College
How to Make a Multiplication Table
Teach children how to make a multiplication table, and they'll be multiplying for life. Following this series of steps, young mathematicians learn to use patterns and the relationships between numbers to create...
Curated OER
Adding Grid-- Fill in the Missing Squares 0 to 15
For this math worksheet, students fill out an addition grid with the facts from 1 to 15. Students add the numbers for each square. There are random answers filled in which are clues for the students.
Curated OER
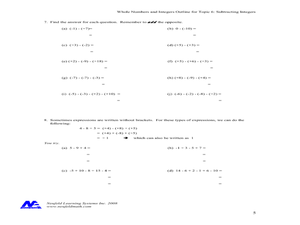
Subtracting Integers
For this subtracting integers worksheet, students complete problems and fill in charts that require them to subtract integers. Students complete 8 problems.
Neufeld Learning Systems
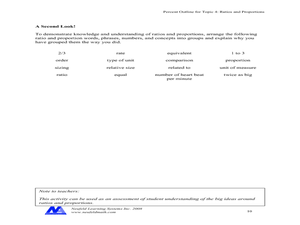
Concept: Ratios and Proportions
Upper elementary and middle school pupils fill out a chart creating six equivalent fractions and then compare them to six different objects and/or shapes. They group together 16 various terms related to ratios and proportions. Pupils...
Curated OER
Tally Charts
In this tally charts worksheet, students fill in the tally chart with the item, tally, and number. Students have 2 tally charts to complete.
Curated OER
Decimal Place Value Chart
For this decimal place value chart worksheet, students work independently to fill in the blanks on the chart so that the numbers equal out correctly and the missing words are stated correctly.
Curated OER
On the Road Again
Students work with patterns to develop formulas that will help them determine total cost. In this patterning activity, students watch a video about an NBA trainer. (not included) They work in groups to access the assigned Internet...
Curated OER
Teaching fractions & ratios with M&Ms
Students collect data using M&Ms, fill in charts, and write ratios and fractions for each color M&M.
Curated OER
Making Cookies- How many per hour?
Fifth graders measure how long it takes to make cookies. In this measuring time lesson, 5th graders explore how to manage time. Students decide when to start making breakfast on time, how to calculate playing time into their lunch time,...
Curated OER
Fore!
In this golf worksheet, students fill in data in a chart about 6 tournaments and answer short answer questions about it. Students fill in 18 spaces in the chart and answer 2 questions.
Curated OER
Meter Reading Using Place Value
Fourth graders watch a video about reading a gas meter and discuss what they saw in the clip. For this place value lesson, 4th graders complete a worksheet where they fill in the missing dials on the meters.
Curated OER
The Meaning of Whole Numbers
In this whole numbers worksheet, students fill in different charts asking about the place value of various whole numbers. Students complete 8 problems.
Curated OER
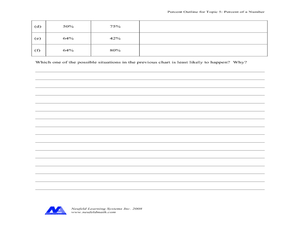
Percent of a Number
In this percent worksheet, students complete problems such as changing percents to decimals, filling in percentage charts, and more. Students complete 8 problems.


