Mathed Up!
Pie Charts
Representing data is as easy as pie. Class members construct pie charts given a frequency table. Individuals then determine the size of the angles needed for each sector and interpret the size of sectors within the context of frequency....
Curated OER
Multiplication Charts
This resource consists of a series of three fill in the blank multiplication charts each of which have different missing information to be plugged in. Students need to fill in a total of 90 numbers over the course of these three pages....
Balanced Assessment
Scale Charts
Develop scales using tables. Pupils complete charts to show equivalent scale factors before using the completed tables to determine the sizes of scale drawings. They finish the lesson and demonstrate their understanding by completing a...
Mathed Up!
Tallys and Charts
After watching a brief instructional video, young mathematicians are put to the test. By completing and reading frequency tables, tally charts, and bar graphs, individuals show their understanding of how to interpret data.
Curated OER
Fill in the Graphs
For this graphing information activity worksheet, students use the 6 provided clues to appropriately fill in the blanks in a pie chart.
Curriculum Corner
Back to School Math and Literacy Centers
From filling in the missing number to filling in the missing letter; to writing fluency sentences to skip counting and matching, a complete set of back to school math a literacy centers will not disappoint. Use these activities...
Curated OER
Hundreds Charts
In this hundreds charts worksheet, students fill in the hundreds charts that are completely blank, have the 5's filled in, and have the 10's filled in. Students have 3 charts to fill in.
Curated OER
Write the Missing Numbers
Which numbers are missing on these hundreds charts? Beginning counters fill in the blank squares in a set of hundreds charts. One simply has the numbers 1 and 100, while the others are missing every other number, only even numbers, or...
Curated OER
Four Algebraic Proof Charts
In this proof chart instructional activity, learners are given an equation and asked to solve for the unknown and to justify the steps by filling in the proof using math properties. The instructional activity contains four problems...
Curated OER
Do You know Saber and Conocer?
Ser and estar aren't the only Spanish words that have a similar meaning. Saber and conocer do too! This worksheet details the slight difference in meaning, organizes the information in two simple charts, and contains fifteen...
Curated OER
Working Out The Workout: Chart Activity
In this chart worksheet, students complete one column in a chart to determine total hours of exercise time, then use the chart to complete 4 additional questions.
Curated OER
Demand curves, Moves Along Demand Curves, and Shifts in Demand Curves
In this economics worksheet, students study a data chart, plot the demand of a hypothetical product, and complete 3 fill in the blank questions. They then study two more demand charts and respond to 3 multiple choice questions and 1...
iCivics
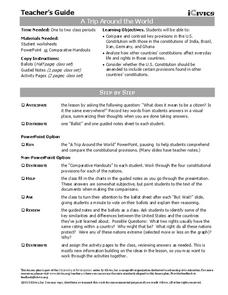
A Trip Around the World
How do the rights of citizens in other countries, such as India, Germany, Brazil, and Iran, compare to those of Americans? Take a closer look at the provisions of various foreign constitutions, and compare and contrast the protections...
Curated OER
Adding Grid-- Fill in the Missing Squares 0 to 15
For this math worksheet, students fill out an addition grid with the facts from 1 to 15. Students add the numbers for each square. There are random answers filled in which are clues for the students.
Curated OER
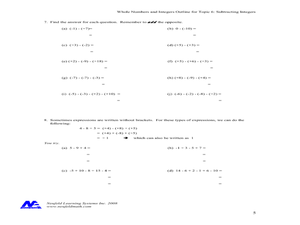
Subtracting Integers
For this subtracting integers worksheet, students complete problems and fill in charts that require them to subtract integers. Students complete 8 problems.
Curated OER
Irregular Past Participles
Even though this activity on past participles is designed for an ESL class, it could work in any class setting. Questions prompt learners to fill in the blanks with past participles, and to think about the functions of participles within...
Neufeld Learning Systems
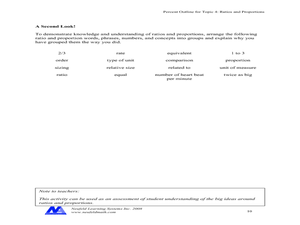
Concept: Ratios and Proportions
Upper elementary and middle school pupils fill out a chart creating six equivalent fractions and then compare them to six different objects and/or shapes. They group together 16 various terms related to ratios and proportions. Pupils...
Curated OER
MLA Bibliography Worksheet
Help your class remember how to cite different sources. Reviewed on this two-page document are books, articles from a database, articles from a magazine, and websites. Examples are provided, and learners use the charts to fill in the...
Curated OER
Decimal Place Value Chart
For this decimal place value chart worksheet, students work independently to fill in the blanks on the chart so that the numbers equal out correctly and the missing words are stated correctly.
Curated OER
Fore!
In this golf worksheet, students fill in data in a chart about 6 tournaments and answer short answer questions about it. Students fill in 18 spaces in the chart and answer 2 questions.
Curated OER
The Meaning of Whole Numbers
In this whole numbers worksheet, students fill in different charts asking about the place value of various whole numbers. Students complete 8 problems.
Curated OER
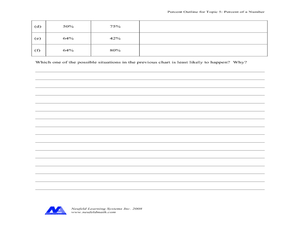
Percent of a Number
In this percent worksheet, students complete problems such as changing percents to decimals, filling in percentage charts, and more. Students complete 8 problems.
PBS
Measuring Waves | UNC-TV Science
Discover the secrets used by scientists to measure mechanical waves. Young physicists learn about measurable wave qualities—amplitude, wavelength, and frequency—by watching and listening to a video discussing longitudinal and transverse...
Curated OER
Addition Number Chart
Number charts are a great way for learners to practice counting and observe number patterns. There are four charts here with missing numbers for scholars to fill out. Each contains some numbers filled in as reference. Challenge...


