Curated OER
Percent of a Number
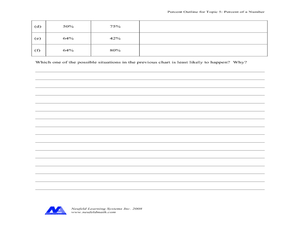
In this percent worksheet, students complete problems such as changing percents to decimals, filling in percentage charts, and more. Students complete 8 problems.
Curated OER
Gases In The Atmosphere
In this science worksheet, students look for the amounts of air composition in the atmosphere by filling in the three different data charts.
Curated OER
Where in the World Is All the Water?
Students investigate the distribution of the earth's water. They conduct a demonstration of water distribution, and create a pie graph to display the results.
Curated OER
The Composition of the Atmosphere
In this atmosphere worksheet, students identify the major components of the earth's atmosphere and write the percentage of each. They also fill in a pie graph of the percent composition of the atmosphere and answer questions about air.
Curated OER
Time Management: Piece of Pie
Learners examine their own lives and how well they manage their time outside of school. In this this time management instructional activity, students discover the amount of time they spend on other activities, and create a pie chart with...
Curated OER
The Composition of the Atmosphere
For this atmosphere worksheet, students list the gases in the atmosphere and their percent composition. They also fill in a pie chart with the gases and their percentages and answer questions about the atmosphere.
Curated OER
A Look at the Life That Electronics Lead
In this comprehension worksheet, students fill in ways on a graphic organizer that people or companies can conserve energy, reduce waste or minimize the impact to the environment. Next, students solve 3 "environmental" math word problems.
Curated OER
Economics: Supply, Demand & Personal Finance
In this Economics/Personal financial literacy worksheet, students use USA Today to find article, photos, charts, or graphics related to events that are affecting the prices of different products and services. Students answer...
Positively Autism
My Family's Thanksgiving
Prepare for the excitement of Thanksgiving with a helpful slideshow presentation. Colorful and engaging, the presentation explores Thanksgiving symbols, details, and traditions, and prompts learners to contrast the given topics with...
Curated OER
Genre Sales Statistics Percent Worksheet
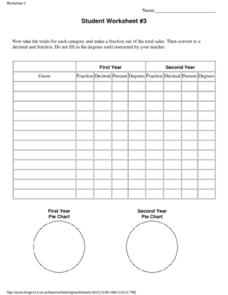
In this literacy worksheet, learners use the context of music genre sales in order to practice the skills of decimal and percentage conversion.
Curated OER
A Woman's Place?
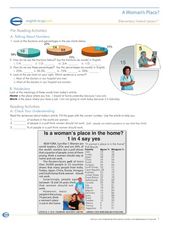
In this women workers lesson, students read an article about women in the workforce and answer 10 questions related to the article. They also convert fractions to percentages.
Curated OER
Possible Causes
Students review any materials from two previous lessons on emissions. As a class, they use a graphic organizer to review their stakeholder's hypothesis. They identify possible causes of global warming and discover how to solve this problem.
US Department of Education
Nces: How to Create a Pie Chart
Resource from the National Center for Education Statistics provides tools and steps for creating printable pie charts online. Fill in the information, click the necessary buttons, and you have created a pie chart!


