Howard Hughes Medical Institute
Evolution in Action: Data Analysis
An environmental factor, such as a drought, sometimes speeds up the rate of natural selection. Scholars analyze data on the beaks of birds around the time of the drought. They compare those that survived to those that perished and find...
CK-12 Foundation
Frequency Tables to Organize and Display Data: Favorite Films
What information can your class determine if they know the number of people attending movie showings? Using the information about the number of people at each screening, learners develop a frequency table. The pupils analyze the type of...
Curated OER
Cutting Expenses
Learners explore budgeting. In this finance and math lesson, students brainstorm ways in which households could save money. Learners view websites that give cost reducing ideas. Students complete an expense comparison chart and use the...
Curated OER
Compare Data Sets
In this comparing data sets practice learning exercise, students sharpen their problem solving skills as they solve 6 story problems.
Curated OER
Aboriginal Statistics
Fourth graders analyze statistics of Native Americans by creating graphs. In this data analysis lesson, 4th graders define different statistical terms and practice finding those statistics from groups of numerical information about...
Bowland
Fashionista
So trendy! Show your class how to identify trends in sales patterns using mathematics. Scholars use a software simulation to collect data on age groups, price, and sales at a fashion store. This data allows individuals to determine the...
Computer Science Unplugged
Lightest and Heaviest—Sorting Algorithms
How do computers sort data lists? Using eight unknown weights and a balance scale, groups determine the order of the weights from lightest to heaviest. A second worksheet provides the groups with other methods to order the weights. The...
Curated OER
Positive Future Fair Project
Ninth graders view the film "Pay It Forward" and discuss what kind of public campaign is needed to move people to positive action. They consider different ways of presenting information (graphs, visual displays, etc.) as tools for...
Curated OER
The Vietnam Lotteries
In this probability and statistics worksheet, students examine the “fairness” to the Vietnam draft lottery system by constructing box plots of each of the twelve months using data provided. The three page worksheet contains one...
Curated OER
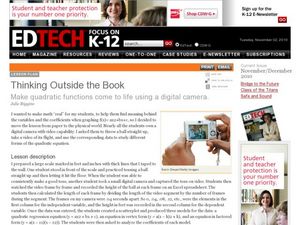
Thinking Outside the Box
Now this lesson sounds fun! Students throw a ball, film it as it soars through the air, and use a spreadsheet to collect data. A scatterplot is created to produce a quadratic regression equation, an equation in vertex form, and an...
Curated OER
Allele and Phenotype Frequencies in Rock Pocket Mouse Populations
In the deserts of Arizona and New Mexico, some tiny creatures show just how quickly natural selection can turn a mutation into an advantageous adaptation. Watch a video about rock pocket mice, who show that one small change can make all...
Howard Hughes Medical Institute
Stickleback Evolution Virtual Lab
How quickly do animals evolve? Can comparing different samples of the same fossil answer timeline questions? Scholars use virtual labs to examine fossils and learn about stickleback evolution. They compare pelvic morphology in lakes...
Curated OER
The Guise of a Graph Gumshoe
Eighth graders practice constructing bar, circle, and box-and-whisker graphs. They practice reading and interpreting data displays and explore how different displays of data can lead to different interpretations.
Curated OER
Real-Life Problems: Time
Combine word problems, telling time, and the four operations. Six problems prompt third graders to write out and solve word problems involving time and timing. Can they finish all six on their own or with a partner?
Curated OER
Chucky Chickadee's Bird and Breakfast: Sing in Please
Students observe bird feeding and complete a tally and graphing activity for their observations. In this bird graphing lesson, students work in teams to observe bird feedings. Students complete a bird reporting sheet and collect data...
AIMS Education Foundation
Classroom Olympics
As the Summer Olympics are approaching, incorporate Olympic-type games into the classroom. From straw javelin to cotton ball shot put, these games are sure to keep leaners engaged. The best part is that there is math involved! Pupils...
Curated OER
Motion Capture and Analysis
Students capture the serve motion of a tennis player with a digital or video camera. Using transparencies or a software package, analyze the speed, acceleration, displacement and time of the racquet head and ball in the tennis stroke.
Curated OER
Jumping in the Air - What was your Height?
Students solve equations using the quadratic formula. In this quadratic equations lesson, students use digital cameras to film students jumping and import film clips into a computer. Students use the data in the quadratic formula...
Curated OER
Leaping Lemurs! How far can you jump?
Learners watch a segment of the PBS video which show the lemurs' ability to jump. In pairs, students collect measurement data involving each other's length of a standard step, a standing broad jump, and a long jump. They record their...
Curated OER
Jazz and Math: The Beat Goes On
Learners collect real data through listening, counting and timing jazz pieces.They use ratios, rates, and proportions to report collected data and demonstrate an understanding of the concepts of rhythm and tempo in music.
Curated OER
A Walk Through Time
Students investigate the types of footwear worn during ten periods of history. In this secondary, art/math/social studies lesson, students view documentaries and popular films to study the time periods. Students research the...
Curated OER
PowerPoint Probability
Sixth graders investigate film making by creating a video about probability. In this math visualization lesson plan, 6th graders create a presentation for their class demonstrating the probability of random events taking place in...
Curated OER
The Tale of Scale
Eighth graders, using a range of data, produce three bar graphs for various scales along the y-axis.
Curated OER
Discovering Pi/Welcome to Pi Day
Students explore pi. In this circle measurement lesson, students define and identify radius, diameter, circumference, and perimeter. Students work in groups to measure several plastic lids and record their findings. Students compare the...
Other popular searches
- Film Analysis Star Wars
- Documentary Film Analysis
- Critical Lens Analysis Film
- Film Analysis Big Fish
- American Film Analysis
- Writing Film Analysis


