Firelands Local Schools
Exponential Growth and Decay
How can you safely model exponential growth and decay? A hands-on activity uses candies to model not only exponential decay, but also exponential growth. Exponential equations are fitted by hand and by use of a calculator to the data...
EngageNY
Linear and Exponential Models—Comparing Growth Rates
Does a linear or exponential model fit the data better? Guide your class through an exploration to answer this question. Pupils create an exponential and linear model for a data set and draw conclusions, based on predictions and the...
College Board
Random Variables vs. Algebraic Variables
Variables can vary in meaning. A reference material for AP® Statistics explains the difference between random and algebraic variables. It provides a hypothetical situation involving dice—great for use in a classroom situation.
Statistics Education Web
Text Messaging is Time Consuming! What Gives?
The more you text, the less you study. Have classes test this hypothesis or another question related to text messages. Using real data, learners use technology to create a scatter plot and calculate a regression line. They create a dot...
EngageNY
Modeling with Quadratic Functions (part 2)
How many points are needed to define a unique parabola? Individuals work with data to answer this question. Ultimately, they determine the quadratic model when given three points. The concept is applied to data from a dropped object,...
Mathematics Vision Project
Modeling Data
Is there a better way to display data to analyze it? Pupils represent data in a variety of ways using number lines, coordinate graphs, and tables. They determine that certain displays work with different types of data and use two-way...
Curated OER
Equations and Inequalities
Students in a college algebra class use graphs to solve inequalities. Using the coordinate graphing system, they represent the relationship between x and y intercepts. They practice solving equations with complex numbers and locate...
Texas Instraments
Angles in Circles
Teach your learners how to investigate the relationship between a central angle and an inscribed angle which subtend the same arc of a circle. The dynamic nature of Cabri Jr. provides opportunity for conjecture and verification.
Curated OER
The Standard Form of A Quadratic Equation
Students investigate equations that are in the standard form of a quadratic equation represented as Y=ax2+bx+c. They factor the equations into linear factors to determine the x intercepts. The graph is also used to determine the x...
Curated OER
Slopes and Lines
Students identify the slopes of a line. In this algebra activity, students calculate the slope and intercept of a line. They graph their lines using a TI calculator.
Curated OER
Quadratic Rules and Graphs
Students identify the properties of quadratic equations. In this algebra lesson, students find the vertex and intercepts of a parabola. They factor quadratics and identify the zeros of the equations.
Curated OER
Linear Functions
Students solve, identify and define linear equations. In this algebra lesson plan, students calculate the slope and y-intercept of a line. They graph the line given two points and the slope.
Curated OER
Lines of Best Fit
Students explore the concept of line of best fit. In this line of best fit instructional activity, students find lines of best fit in examples about riding your bike home from school and dentistry. Students find two data points and find...
Curated OER
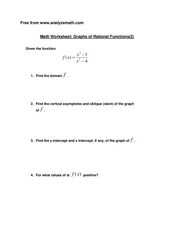
Math Worksheet: Graphs of Rations Functions (2)
In this Algebra II worksheet, 11th graders examine a rational function as they determine the domain, vertical asymptotes, x- and y-intercepts and graph the function. The two page worksheet contains five problems that relate to the one...
Curated OER
Investigating Parabolas
Students identify properties of parabolas. For this algebra lesson, students factor quadratic equations and identify the properties of parabolas. They find the roots, vertex and intercepts of a parabola.
Curated OER
Topic 2.2 - Graphing Linear Equations
In this linear equation worksheet, students write 9 linear equations in Standard Form. They then find the x and y-intercept of the graph of each of 6 equations. Finally, students graph 6 equations on the blank graphs provided on the page.
Curated OER
Identifying slope from Equations
Students find the slope of a line given a linear equation in slope-intercept form. They also find the slope of a line given a linear equation in standard form. Students finally graph the line to show it visually.
Math Worksheet Center
Linear Quadratic Systems
In this linear quadratic system learning exercise, learners explore a system with a linear and a quadratic equation. With the given equations, students graph the parabola. They identify the axis of symmetry, the slope, points of...
Curated OER
Write the Equation of a Line Given the Slope and a Point
Students write the equation of a line given the slope and y-intercept. For this algebra lesson, students are given a point a the line and the slope of the line and are asked to write an equation of the line. They relate lines to real...
Curated OER
Worksheet 9, Rational Functions
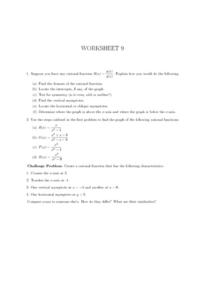
In this algebra worksheet, students tell how they would find the domain of a rational function. They find the intercepts of a rational function and graph it. Students test for symmetry, locate the asymptotes and determine where the graph...
Curated OER
Worksheet 8, Exponents
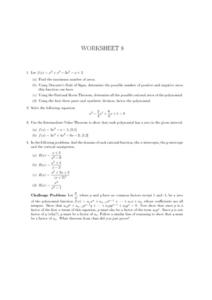
In this calculus worksheet, students analyze one equation by finding the maximum number of zeros. They use Descarte's Rule of Signs and the rational roots theorem. Students use synthetic division to factor the polynomial. Students solve...
Curated OER
Products of Linear Functions
Students investigate the horizontal intercepts of functions. In this algebra lesson, students identify whether the factor of two functions results in a quadratic equation or not. They compare and contrast linear equations and higher...
Curated OER
Writing in the Math Classroom
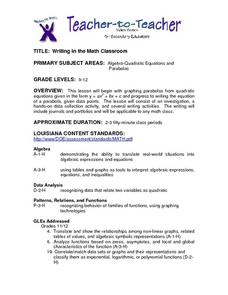
Pupils determine the vertex, y-intercept and direction of a parabola and write an explanation of how to graph a parabola. They collect and graph data using a calculator.
Curated OER
Graphs of Functions
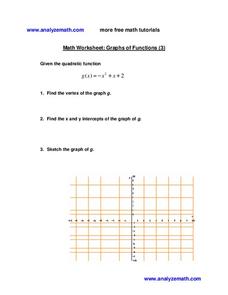
For this graphs of functions worksheet, students identify the vertex, the x and y intercept and graph a quadratic function. This one-page worksheet contains 1 multi-step problem.


