Curated OER
Graphing Inequalities and Shading
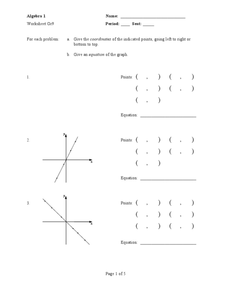
Students graph and shade inequalities. In this algebra instructional activity, students graph inequalities using the slope-intercept form. They shade the side of the line that is the solution and identify the domain and range.
Curated OER
Linear Graphs and Equations
In this linear graph and equations instructional activity, students calculate the gradient of slopes, and find equations of lines in patterns.
Curated OER
Coordinates and Equations
In this algebra worksheet, students solve linear equations and plot their results on the coordinate plane. There are 20 problems using slopes and intercepts to help graph linear equations.
Curated OER
The Right Angle
In this algebra worksheet, pupils rewrite word problems using an algebraic equation to find the answer. There are 14 questions with an answer key.
Curated OER
Implicit Differentiation
Students implicitly differentiate functions . For this implicitly differentiating functions lesson, students take the derivative of functions that cannot be solved for a variable. Students find the derivative of an equation...
Curated OER
Race Track (Culminating Activity)
Students graph and solve linear equations. In this algebra lesson, students use the slope and y-intercept to graph lines. They relate lines to the real world using different applications.
Curated OER
Historical Geography Scavenger Hunt
High schoolers are told that Geography is the science that deals with the differentiation of the surface of the earth due to the influence of things like population, vegetation, geology, and land use. They explore the Geography Basics...
Curated OER
Real-World Linear Equations
Eighth graders practice technology skills through the use of a spreadsheet and a discovery lesson focusing upon linear equations. The technology allows for the visual changes to be displayed for different lines of equations.
Curated OER
Sustainable Agriculture
Students perform an experiment to find out if plants grow best when grown in soil with no fertilizer, with chemical fertilizers, or with compost that they have made themselves. Students discover how agriculture practices can benefit the...
Curated OER
Linear Functions, Restricted Domains, Infinite Geometric Series, Interconnections
In this math worksheet, students graph the linear functions in comparison to the inequalities. Then they compare the line segments on the coordinate plane.
Curated OER
Academic Algebra II 1st Semester Exam
In the semester exam, students solve problems dealing the the discriminant of quadratic equations, systems of equations, linear equations and inequalities. Students also simplify radicals, complete squares, and find the inverse...
Curated OER
Particle Motion1
Students analyze piecewise functions. In this precalculus lesson, students identify the position, velocity and distance. They analyze the relationship between the graph, its position and velocity.
Curated OER
Confusing Colors!
Fourth graders collect data, graph their data, and then make predictions based upon their findings. They's interest is maintained by the interesting way the data is collected. The data collection experiment is from the psychology work of...
Curated OER
Groundwater Pollution Site Assessment
Students study how a geologist examines a hazardous waste spill using an actual site. They use site data to map the spill, find its source and determine how fast the spill is spreading.
Curated OER
Ohm's Law
Students explain the meaning of Ohm's Law, and plot a graph of voltage versus current, by explaining how the slope is the resistance of the circuit.
Curated OER
The Circumference and Diameter of a Circle
Ninth graders investigate the finding of the diameter of a circle in order to extend the practice towards finding the circumference. They differentiate between the distance measured across a circle from that of around the perimeter.
Curated OER
Lesson Plan On Fran Data
Seventh graders investigate the concept of functions and how they are used in the context of the real world while identifying the dependent and independent variables. They graph relations and functions and find the zeros of functions....
Curated OER
Speed Is the Key
Students design and build a model downhill ski course that proves to be the fastest course at the Finish Line. They apply what they explore angles, slope, speed, and surface conditions to find the fastest course in the US.
Curated OER
Crossword
In this crossword worksheet that focuses on natural disasters, students find the vertical word in the colored squares by filling in the right words in ten lines in the horizontal boxes. Answers appear at the bottom of the worksheet.
Curated OER
Population and Food Supply
What does it mean for something to grow exponentially, and how does that compare to linear growth? This activity tries to help learners gain an understanding of these concepts while modeling real-world problems. Linear and exponential...
Mathematics Vision Project
Module 6: Congruence, Construction, and Proof
Trace the links between a variety of math concepts in this far-reaching unit. Ideas that seem very different on the outset (like the distance formula and rigid transformations) come together in very natural and logical ways. This...
University of Texas
A Library of Parent Functions
Don't think this lesson is for Mom and Dad; parent functions are all for your high schoolers. Flip through a presentation with a focus slide on each type of graph and its characteristics. Some examples are included but the...
Alabama Learning Exchange
What You Know About the Bermuda Triangle?
Get lost in the classifications. Using the backdrop of the Bermuda Triangle, pupils classify it by angle and side measures. They also learn information about the triangle and its history.
Kenan Fellows
Man vs. Beast: Approximating Derivatives using Human and Animal Movement
What does dropping a ball look like as a graph? An engaging activity asks learners to record a video of dropping a ball and uploading the video to software for analysis. They compare the position of the ball to time and calculate the...


