EngageNY
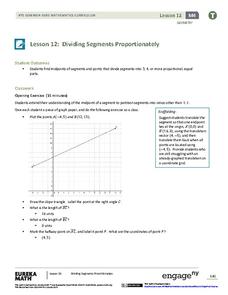
Dividing Segments Proportionately
Fractions, ratios, and proportions: what do they have to do with segments? Scholars discover the midpoint formula through coordinate geometry. Next, they expand on the formula to apply it to dividing the segment into different...
EngageNY
Nonlinear Models in a Data Context
How well does your garden grow? Model the growth of dahlias with nonlinear functions. In the lesson, scholars build on their understanding of mathematical models with nonlinear models. They look at dahlias growing in compost and...
EngageNY
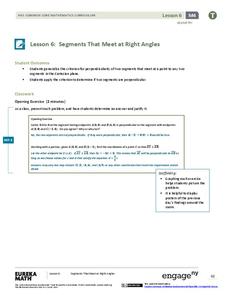
Segments That Meet at Right Angles
Can segments be considered perpendicular if they don't intersect? Learners look at nonintersecting segments on the coordinate plane and make conclusions about the lines that contain those segments. They determine if they are...
Curated OER
Algebra I - Test
Students participate in a lesson that reviews the concept of linear functions in connection with preparation for an exam. The teacher reviews problems with the students for scaffolding. Students practice graphing linear functions.
Curated OER
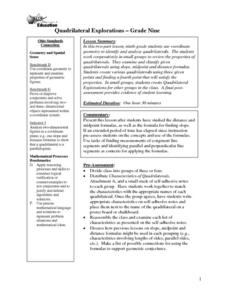
Quadrilateral Explorations
Ninth graders identify quadrilaterals and label the vertices of quadrilaterals. they justify their identification of the quadrilaterals. Students work in groups to identify and create quadrilaterals
Curated OER
Local Linearity and the Microscope Approximation
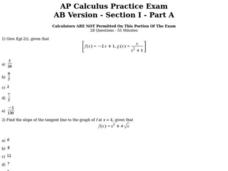
In this local linearity worksheet, students identify the slope of a line tangent to the graph at a given point. They use linear approximation to estimate values. Students determine the slope of a secant line at a given point. This...
Curated OER
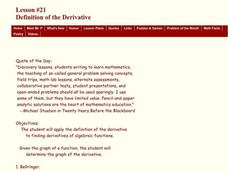
Definition of the Derivative
Students find the derivatives of functions. In this finding the derivatives of functions lesson, students use the definition of derivative to take the derivative of a function. Students discuss scenarios in which the...
Curated OER
Linear Functions
Students solve, identify and define linear equations. In this algebra lesson, students calculate the slope and y-intercept of a line. They graph the line given two points and the slope.
Curated OER
Linear Equations and Cell Phone Plans
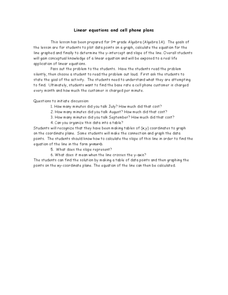
Students calculate the amount of minutes they get charged for each month. In this algebra lesson, students relate linear equations to talking on the phone and the cost to do so. They create graph to plot the cost and usage of the cell...
Curated OER
The Ocean Floor - Science
Learners draw a quick plan of an ocean floor as seen from the side; including the edge of a continent, a continental shelf, a continental slope, a basin, a trench, and a range. They require their definitions to do this.
Curated OER
Straight Line Motion with a Stomper
Young scholars explore average speed, and graph distances and time. In this speed and velocity lesson students complete a lab then calculate distances, acceleration and velocity and graph the data.
Curated OER
Binary Numbers
In this algebra activity, learners perform binary addition, subtraction and division to find the binary base for decimals between 0-31. There are 31 questions.
Curated OER
Iterating Linear Functions
Young scholars use a spreadsheet to investigate data. In this algebra lesson, students collect and graph data on a coordinate plane. They explain properties of a linear equation both algebraically and orally.
Curated OER
Price of Apples- Linear Data
Students collect data and create a graph. In this algebra lesson, students describe functions graphically, algebraically and verbally. They identify functions as being independent and dependent using variables.
Curated OER
Solving Systems of Linear Equations Graphically
Students solve systems of equations graphically. In this algebra lesson, students find the point of intersection of two lines if they are not parallel. They rewrite the equation in the y=mx + b form and graph using slope and intercept.
Curated OER
Relating Distance and Velocity Over Time
Students calculate the distance and velocity over time. In this algebra lesson, students graph a linear function to represent the distance vers time travel. They interpret their graphs and draw conclusion.
Curated OER
Higher Order Taylor Polynomials
In this polynomial worksheet, students approximate values of linearly using the tangent line. They use first and second-degree polynomials to find the equation of a line tangent to a graph. Students explore Taylor's Theorem. This...
Curated OER
Linear Equations Project Fram
Students engage in a lesson that focuses on the concept of linear equations. They practice solving problems with a variety of problems and graphing the solution set for each. Students write a summary paragraph about two methods of...
Curated OER
Worksheet 18
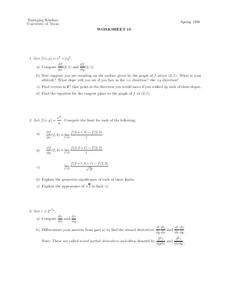
In this math learning exercise, students graph the function. Then they determine the altitude in relation to the graph of the function using point (2,1).
Curated OER
Choosing a Summer Job
What did you do over your summer vacation. Young wage earners must compare summer job options, and determine when each job earn the same amount and what that amount be. This be done by creating, graphing, and solving systems of...
Curated OER
Discovering The Ratio Pi And The Diameter
Students relate the ratio of Pi to the diameter of a circle. In this geometry instructional activity, students investigate the relationship of the chord of the circle the the number Pi. They define ration, chord, circumference and...
Curated OER
Epidemic or False Alert?
In this rate worksheet, students use the SIR model to determine if a disease is spreading at an epidemic rate. They find the slope of a curve and the slope of a line that goes through a given point. This two-page worksheet contains...
Curated OER
Minima/Maxima
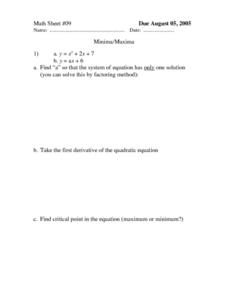
In this minima/maxima activity, students solve systems of equations, identify the first derivative of a quadratic equation, and find the critical point in an equation. Using Excel worksheets, students graph four equations. There are...
Curated OER
Absolute Maximum and Minimum
Pupils calculate the maximum and minimum of each function. In this algebra lesson, students collect and graph data to analyze it. They differentiate between the absolute max and min and the maxima and minima of each function.
