University of California
University of California at Berkeley: How Science Works Flowchart [Pdf]
A flowchart for elementary students outlining how the scientific process works.
John Wiley & Sons
Wiley: Flowchart Symbols
Defines a flowchart as a graphic representation of an algorithm, often used in the design phase of programming to work out the logical flow of a program. Shows typical flowchart symbols.
Other
Bucks County Community College: Visual Organizers
This site walks you through the benefits of visual organizers, and focuses on a variety of types: tables, charts, graphs, timelines, flowcharts, diagrams, and webs.
Flow of History
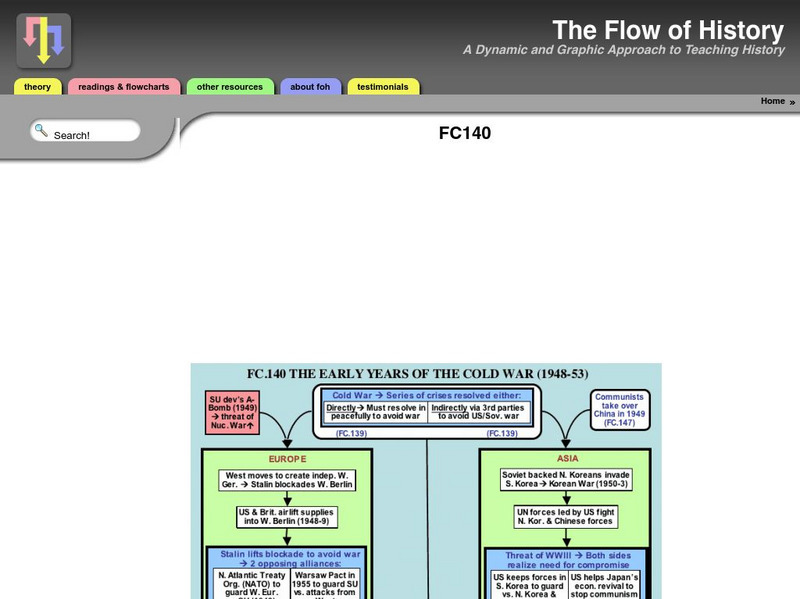
Flow of History: The Early Years of the Cold War
The early years of the Cold War & how it affected the main players...Germany, USA, Russia, Asia...is profiled. Text plus a colored graphic flowchart make this topic visually appealing and of interest to both students and educators.
Flow of History
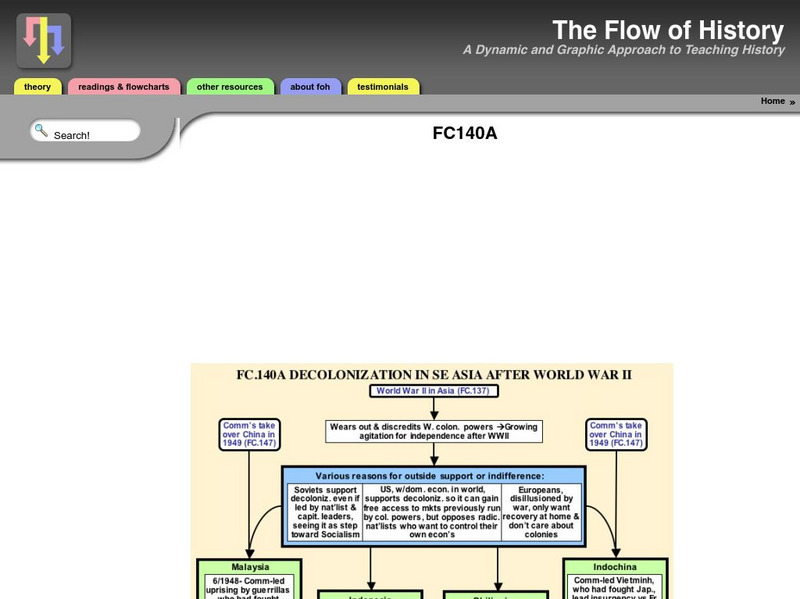
Flow of History: Decolonization of Se Asia After Ww Ii
The changes in status of the nations of SE Asia following World War II is the focus. Text plus a colored graphic flowchart make the topic visually appealing and of interest to both students and educators.
Flow of History
Flow of History: American Foreign Policy and Vietnam War (1954 75)
The foreign policy of the United States and the Vietnam War are the focus. Text plus a colored graphic flowchart make the topic visually appealing and of interest to both students and educators.
Flow of History
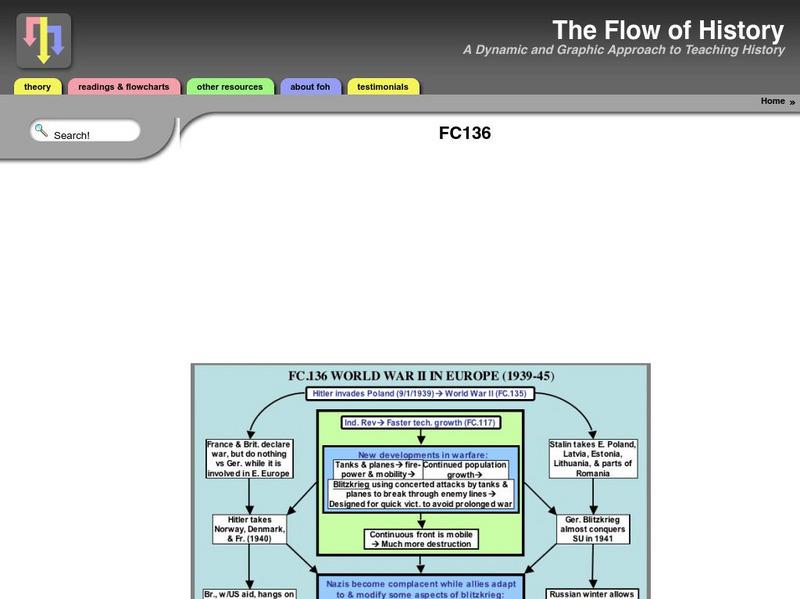
Flow of History: World War Two in Europe
The outbreak of World War Two in Europe began with Hitler's invasion of Poland. Through text and a colored graphic flowchart, the events and battles and eventual end of the war, can be visually traced. Suitable for both students and...
Flow of History
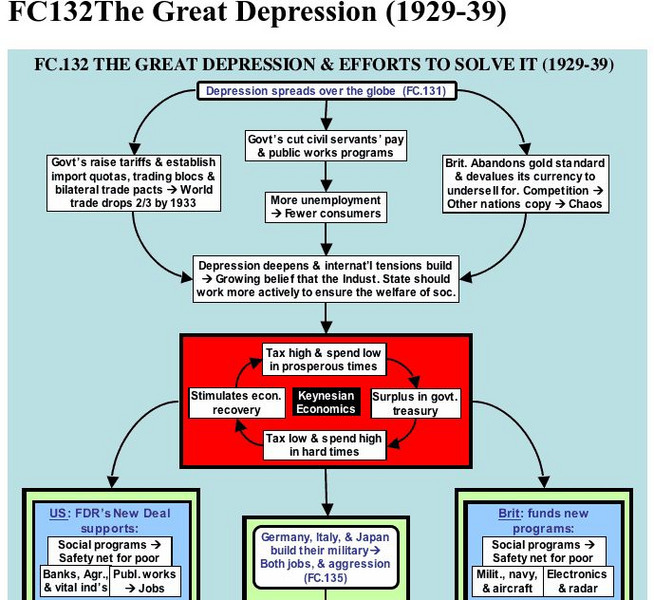
Flow of History: The Great Depression
The Great Depression, its causes and effects, is profiled through text and a colored graphic flowchart of events. Visually appealing for both students and teachers.
Indiana University
Indiana University Bloomington: Rock Identification Chart [Pdf]
A flowchart students can use as a tool to identify rocks. They answer yes or no to questions about various characteristics and responses to tests until they can narrow down the possibilities.
Indiana University
Indiana University Bloomington: Fossil Identification Chart [Pdf]
A flowchart students can use as a tool to identify fossils based on their physical characteristics, e.g., segmentation, symmetry, lack of a skeleton, etc.
Curated OER
Fc145
The 1960's were a time of social rebellion, fights for freedoms, and the creation of a counterculture. Text plus a colorful graphic flowchart takes one through the many events leading up to the 1960's! Visually appealing and of interest...
Sophia Learning
Sophia: Note Taking: Concept Maps and Flow Charts
This slideshow lesson focuses on note taking using concept maps and flow charts; it provides background information, 6 types of concept maps or flow charts with best uses, uses in the classroom, uses while reading or researching, and how...
Other popular searches
- Flowcharts and Equations
- Programming Flowcharts
- Computer Flowcharts
- Flowcharts Chocolate
- Flowcharts on Product
- Marine Flowcharts
- Food Production Flowcharts
- Economics Flowcharts
- Flowcharts Symbols
- Flowcharts Computers
- Sequencing Flowcharts
![University of California at Berkeley: How Science Works Flowchart [Pdf] Graphic University of California at Berkeley: How Science Works Flowchart [Pdf] Graphic](https://d15y2dacu3jp90.cloudfront.net/images/attachment_defaults/resource/large/FPO-knovation.png)


