Curated OER
Graphing Quadratic Equations with a Coefficient of One
This is a teacher page for a lesson and does not include any materials to support the lesson. High schoolers graph quadratic equations with a coefficient of one and create a table of values to graph a quadratic equation. They plot the...
Curated OER
Perimeter and Circumference
Students understand the definitions for perimeter and circumference and know the difference. They then go over sample problems as a class. Students use drill and practice skills to complete activity pages.
Curated OER
Using Computer for Statistical Analysis
Young scholars use the computer and S'COOL data for statistical analysis.
Curated OER
Fill and Wrap It Up
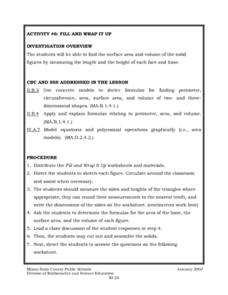
Students find the surface area and volume of the solid figures by measuring the length and the height of each face and base. They use concrete models to derive formulas for finding perimeter, circumference, area, surface area, and volume...
Curated OER
Old Glory
Students utilize mathematical concepts such as: measurement, ratio and proportion and geometric probability to analyze the components of the U.S. Flag. They collect, organize and interpret data by constructing charts, tables and graphs...
Curated OER
Cover and Boarders
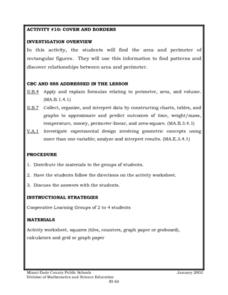
Students find the area and perimeter of rectangular figures. They use this information to find patterns and discover relationships between area and perimeter. Students apply and explain formulas relating to perimeter, area, and volume.
Curated OER
How Many?
In this counting worksheet, students count the number of items in each problem and write how many there are. Students complete 7 problems.
Curated OER
Ocean Life: A Heavy Subject
Second graders examine The Learning Page Fact Files about ocean life and categorize the data by weight and group. They distinguish between fish, mammals, and invertebrates and which weigh the most and the least. Students record their...
Curated OER
Dance, Dance, Dance
Use dance and song to help your charges in adding whole numbers to 10. In this adding to 10 lesson, learners become the manipulatives as you add them.
Curated OER
A Rectangular Prism and Its Net
Identify the nets for prisms and other geometric shapes. Learners calculate the surface area of the rectangular prism then sketch the shapes of prisms and other polygons. Unfolded cereal boxes are used as a visual aid, great idea!
Curated OER
Area And Perimeter Using Pentominoes
Third graders engage in an enrichment lesson exploring the concepts of area and perimeter. They construct new pentominoes that are 3 times the size of normal ones and then identify the area and perimeter measurements. They then create a...
Curated OER
Cap-It to the Max
Eighth graders compare the volume of three cylinders constructed from the same size sheet of paper. They use concrete and graphical models to derive formulas for finding perimeter, circumference, area, and volume of two and three...
Curated OER
The Right Stuff
Studentsare introduced to the Pythagorean Theorem by exploring right triangles and the squares built on each side. They apply the Pythagorean Theorem to real-world problems. Students u se informal and nonformal arguments of proof (i.e.,...
Curated OER
Long Distance Phone Plans
In this long distance phone plane worksheet, students compare various phone plans and determine which long distance plan has the greatest savings. Students support their answers visually through the use of tables and graphs. They write...
Georgia Learning Connections
Stand By Me!
Get your little mathematicians moving with this experiential activity in which one child is the "tens" and another is the "ones." They collect the number of unifix cubes (in tens or singles) assigned to their respective place values and...
Curated OER
How's The Weather?
Students make a box and whiskers plot using the TI-73 graphing calculator. Each student would have their own calculator but they would work in small groups of two or three to help each other enter the data and make the plots.
Curated OER
Graph Paper Patterns
Young artists divide a piece of graph paper into sections using rectangles, squares, and triangles. They then fill each section with patterns of shape and color. Elementary graders describe how their patterns are organized. Secondary...
Curated OER
Frost Depth Study
Students complete activities to study the frost and frost depth. For this frost study lesson, students use frost tubes to study and measure the frost at their school. Students measure the frost in the tube and enter their data online to...
Curated OER
Agriculture & Alaska's Economy
Students examine Alaska's agriculture numbers from previous years. They answer questions based on Alaska's production levels.
Curated OER
Data Analysis of Ground Level Ozone
Sixth graders construct and interpret graphs from ozone data collected in Phoenix area. Can be adapted to other areas.
Curated OER
Greater Than, Less Than, or Equal To
Elementary schoolers explore using the symbols for greater than, less than, and equal to in various equations. They discuss the different signs used in equations and what each sign represents. Learners practice using the various signs.
Curated OER
Signed Number Operations and Absolute Value
Students examine methods for adding, subtracting, multiplying and dividing signed numbers. The observe animated illustrations of each operation. students discover the basic meaning of absolute value. They compute problems after instruction.
Curated OER
THE TRIANGLE INEQUALITY IN ANIMATION
Pupils open up the script to generate the sketch. They examine the viewing of the animation of a triangle. Students incorporate writing skills across the curriculum within this lesson.
Curated OER
Height versus Shoe Size
Students find a correlation between a person's height and his/her shoe size. They have access to entering data into lists on a graphing calculator and can complete scatter plots. Students read and interpret a scatter plot and use the...


