Curated OER
Flicking Football Fun
Young mathematicians fold and flick their way to a deeper understanding of statistics with a fun, hands-on math unit. Over the course of four lessons, students use paper footballs to generate data as they learn how to create line...
Teach Hub
Super Bowl Classroom Activities
Need some help getting young football fans to focus on something besides the Super Bowl? Use a list of football-themed activities for art, math, science, nutrition, language arts, and social studies to get their heads in the game!
Curated OER
Statistics
In this statistics worksheet, learners solve and complete 6 different problems that include determining various types of statistics. First, they determine the data set where the median value is equal to the mean value. Then, students use...
Curated OER
Statistics
In this statistics activity, 9th graders solve and complete 10 various types of problems that include using different types of graphs to illustrate data. First, they determine the median score for each stem-and-leaf plot. Then, students...
Curated OER
Practice: Word Problems
Congratulations, you've just hit the word problem jackpot! Covering an incredible range of topics from integers and fractions, to percents, geometry, and much more, this collection of worksheets will keep young mathematicians busy...
Curated OER
Rating a Quarterback in Football: Statistics, Math, Ratings
Students find out how football statistics are derived, compute quarterback ratings for themselves and interpret quarterback ratings in order to investigate what a player must do to improve ratings.
Yummy Math
Should NFL Quarterbacks Shave or Grow a Beard?
What does facial hair have to do with quarterback ratings? Using a set of data that provides QBR with and without facial hair, football enthusiasts determine if performance is affected. It also has learners question if the relationship...
Curated OER
Mathematics and Football
Students analyze information represented graphically. In this third through fifth grade mathematics lesson, students apply mathematical knowledge to solve real-world problems relating to the Super Bowl. The activities involve number...
Curated OER
Super Bowl Champs
In this Super Bowl worksheet, students create line plots of all winners and losers of the Super Bowl. They create stem-and-leaf plots, scatter plots, and bar graphs of football data. This one-page worksheet contains 5 multi-step problems.
Curated OER
Statistical Diagrams
In this statistics worksheet, students explore five activities that require analysis and interpretation of maps, charts, and scatter plots. The six page lesson includes five activities or experiments with short answer questions. ...
Curated OER
Sports Teams & Math
Learners collect sports data, keep track of wiins, losses and scores and average the teams' scores.
Virginia Department of Education
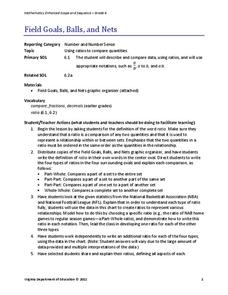
Field Goals, Balls, and Nets
Score a resource on ratios. Young mathematicians learn about different ways to express ratios. Using sports data, they write statements about the statistics in ratio form.
Curated OER
Math: Football League Statistics
Students examine a soccer league final standings chart and then answer 12 questions based on the information provided. They calculate some answers in both fractions and percentages.
Curated OER
Math: Football Fever Fun
Students compile statistics from high school or other football team and construct a spreadsheet on which to record their findings. Using Chart Wizard to analyze the data, they construct charts and graphs for a visual display of the...
Curated OER
Mr. Cobbler's Shoe Dilemma
Students employ statistics to solve real-world problems. They collect, organize and describe data. They make inferences based on data analysis. They construct, read, and interpret tables, charts and graphs.
Curated OER
Matrix Operations
Two real-world activities to practice adding, subtracting and multiplying matrices to problem solve. Data from several Pro football quarterbacks is used in one activity to make some predictions based on their stats. Then the class takes...
Curated OER
Football Statistics
In this math worksheet, students examine the statistical information as provided in the graphic organizer and calculate the other values.
Curated OER
Introduction to Descriptive Statistics
Learners follow examples to study basic concepts of statistics. They work independently through the activities.
Curated OER
Data Analysis and Bias
In this probability and statistics worksheet, learners determine when a collected data or a graph of the data could be biased. The one page worksheet contains four multiple choice questions. Answers are included.
Curated OER
The Football and Braking Distance: Model Data with Quadratic Functions
Young scholars engage in a lesson that is about the concept of data analysis with the use of quadratics. They use a Precalculus text in order to give guidance for independent practice and to serve as a source for the teacher to use. The...
EngageNY
Chance Experiments
Class members are introduced to probability using terms such as impossible, unlikely, likely, and certain. Numbers between zero and one are associated with the descriptions of probability. Pupils find the likelihood of chance experiments...
Curated OER
Heads or Tails
Seventh graders compare experimental and theoretical probabilities. In this comparing experimental and theoretical probabilities activity, 7th graders discuss the theoretical probability of flipping a coin. Students flip a coin 25...
Curated OER
Matrix Operations
Students solve problems using matrices. In this algebra lesson, students add, subtract and multiply matrices. They use the graphing calculator to simplify and graph linear equations.
Curated OER
Frequency Distributions and Measures of Central Tendency
Twelfth graders use the Internet to research information on NFL players and construct frequency distributions from the data. They calculate the mean, medium and analyze their data.


