EngageNY
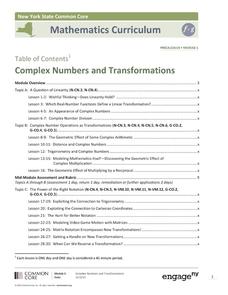
Complex Numbers and Transformations
Your learners combine their knowledge of real and imaginary numbers and matrices in an activity containing thirty lessons, two assessments (mid-module and end module), and their corresponding rubrics. Centered on complex numbers and...
EngageNY
Polynomial, Rational, and Radical Relationships
This assessment pair goes way beyond simple graphing, factoring and solving polynomial equations, really forcing learners to investigate the math ideas behind the calculations. Short and to-the-point questions build on one another,...
Kenan Fellows
Math Made Simple as 1-2-3: Simplified Educational Approach to Algebra
Writing an equation of a line is as easy as m and b. A lesson presentation gives individuals different strategies for writing equations of lines. Some items provide a slope and a point while others provide two points. Whatever the given,...
EngageNY
End-of-Module Assessment Task: Pre-Calculus Module 2
Assess pupil understanding of the relationship between matrices, vectors, linear transformations, and parametric equations. Questions range from recall to more complex levels of thinking. Problems represent topics learned throughout the...
Curated OER
Interpreting Graphs
Sixth graders interpret linear and nonlinear graphs. They create graphs based on a problem set. Next, they represent quantitive relationships on a graph and write a story related to graphing.
CCSS Math Activities
Picking Apples
Pick the resource while it's ripe. A performance task challenges young mathematicians to consider the costs of apple picking. They compare the costs for two different orchards for different situations.
CK-12 Foundation
Function Rules for Input-Output Tables: Soda Sugar Function Table
Examine the relationship between the input and output variables in a table of values. As learners build an input-output table using online manipulatives, they begin to identify patterns. They answer questions about these patterns...
Curated OER
Basketball Bounces, Assessment Variation 2
This un-scaffold summative assessment tasks learners to use the height of a bouncing basketball, given the data in graph and table form, to choose the model that is represented. Learners then use the model to answer questions about...
Curated OER
Basketball Bounces, Assessment Variation 1
This highly scaffolded, summative assessment tasks learners to choose the model that represents the height of a bouncing basketball given the data in graph and table form. Learners then use the model to answer questions about the...
Curated OER
Beginning Modeling for Linear and Quadratic Data
Students create models to represent both linear and quadratic equations. In this algebra lesson, students collect data from the real world and analyze it. They graph and differentiate between the two types.
Curated OER
Functions Mixed Review: Pracctice A
Ninth graders review their knowledge of functions. In this Algebra I instructional activity, 9th graders determine if equations are linear or nonlinear, determine the slope and y-intercept of equations, and determine if a relation...
Curated OER
Generating Points and Graphing
Students create a table of values to help them plot. In this algebra activity, students plot their points on a coordinate plane creating a graph. They observe and analyze linear functions.
Curated OER
Mobile vs. Money
Learners research the internet and use the information they find to plot straight line graphs. They use graphs to make comparisons of the various packages offered. Students interpret graphs and solve problems based on varying parameters.
Curated OER
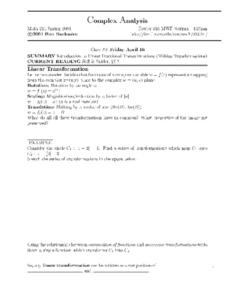
Complex Analysis: Linear Fractional Transformations
In this transformation worksheet, students explore linear transformations and mappings. They map equations on a coordinate plane. This two-page worksheet contains approximately three problems.
Curated OER
Numerical Analysis: Nonlinear Equations
In this nonlinear equations instructional activity, students use iterative methods for solving systems of nonlinear equations. This four-page instructional activity contains eight multi-step problems.
Curated OER
Linear Regression on TI-82
In this linear regression worksheet, students graph linear regression problems using the TI-82 calculator. Instructions for using the calculator are provided. This two-page worksheet contains six problems.
Curated OER
Linear Graphs and Equations
In this linear graph and equations instructional activity, students calculate the gradient of slopes, and find equations of lines in patterns.
Curated OER
Graphing 3 Ways
In this graphing worksheet, students graph 10 equations using the following methods: slope-intercept form, x- and y-intercepts, or by using a table. Students check their work using a graphing calculator.
Curated OER
More Graphing With Intercepts
In this graphing worksheet, students graph linear equations. They identify the x or y-intercept. Coordinate planes are available below each equation. Nine problems are provided on this two-page worksheet.
Curated OER
Condensing Section 4.1
In this differential equations instructional activity, students solve three sets of questions. The first section is titled "Existence and Uniqueness." The second section is titled "Linear Independence and Dependence," and the third...
Texas Instruments
A Tale of Two Lines
Students graph systems of equation. In this calculus lesson, students graph their lines on a TI calculator. They identify the point of intersection and the type of solution.
Curated OER
Properties of Logarithms
High schoolers explore the concept of logarithms. In this logarithms lesson, students discuss the logarithm properties. High schoolers use linear functions as a basis to develop the logarithm properites by substituting log b...
Curated OER
Parabolas
High schoolers investigate parabolas and their equations. In this parabolas and their equations lesson, students graph quadratic equations on their graphing calculator. High schoolers find the axis of symmetry of a...
Curated OER
Connecting Factors and Zeros
In this Algebra II lesson, students explore the connection between the factored form of a quadratics and the zero of a function. Students use a graphing calculator to verify factoring numerically and graphically.


