Biology Junction
Population Genetics
Genetic variation shows the health of a population, yet cheetahs show very little variation over that last 10,000 years. Scholars learn the importance of genetic variation in populations after viewing an informative presentation. It...
Achieve
Ground Beef
Ever wonder how a butcher creates the different types of ground beef? Young mathematicians explore the methods butchers use to create their desired ground beef quality. Given a combination of two types of meat with varying...
Curated OER
Comparison of Snow Cover on Different Continents
Students use the Live Access Server (LAS) to form maps and a numerical text file of snow cover for each continent on a particular date. They analyze the data for each map and corresponding text file to determine an estimate of snow cover...
Curated OER
Aruba Cloud Cover Measured by Satellite
Learners analyze cloud cover and to compose written conclusions to a given related scenario. They submit a letter of response and a report detailing their calculations and conclusions.
Curated OER
Whose Breakfast isn't for the Birds?
Students explore coffee production. In this cross-curriculum rainforest ecology lesson, students research regions where coffee comes from and investigate how the native birds in the rainforest are effected by coffee...
Curated OER
A Statistical Look at Jewish History
Students complete their examination over the Jewish Diaspora. Using population figures, they discover the importance of percentages in exploring trends. They use their own ethnic group and determine how it is represented in the United...
Curated OER
Exploring Linear Equations And Scatter Plots - Chapter 5 Review
Students complete rolling stocks experiment, and collect and enter data on the computer. They enter data on graphing calculators, complete scatter plot by hand with line of best fit, and discuss different graphing methods.
Curated OER
Blood Brothers
Students study the blood characteristics of a number of distinct racial/ethnic groups. They build skills in observation, information gathering and processing. Students experiences strongly reflect the nature and intent of the current...
Curated OER
Snow Cover By Latitude
Students examine computerized data maps in order to create graphs of the amount of snowfall found at certain latitudes by date. Then they compare the graphs and the data they represent. Students present an analysis of the graphs.
Curated OER
Data Shuffle
Students find an advertisement or newspaper using charts or graphs. They create another graph using the same information in a different format. They write a comparison of the two graphs.
Curated OER
Bullying-studying it to curb it....
Students will engage in a variety of research activities to write what the latest facts are concerning the issue of bullying. This issue is relevant to the lives of learners in schools, which will make for an high interest lesson.
Cuemath
Cuemath: Frequency Distribution Table
A comprehensive guide for learning all about frequency distribution tables with definitions, how to create a frequency distribution table, and the formulas and graphs related to frequency distributions. With solved examples and...
Math Is Fun
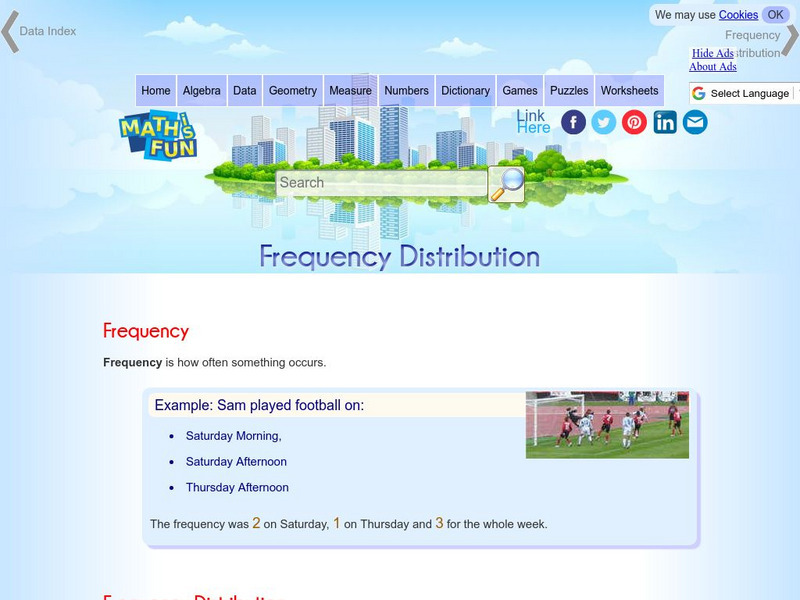
Math Is Fun: Frequency Distribution
Explains, with examples, what a frequency distribution table is. Includes a set of practice questions.
Missouri State University
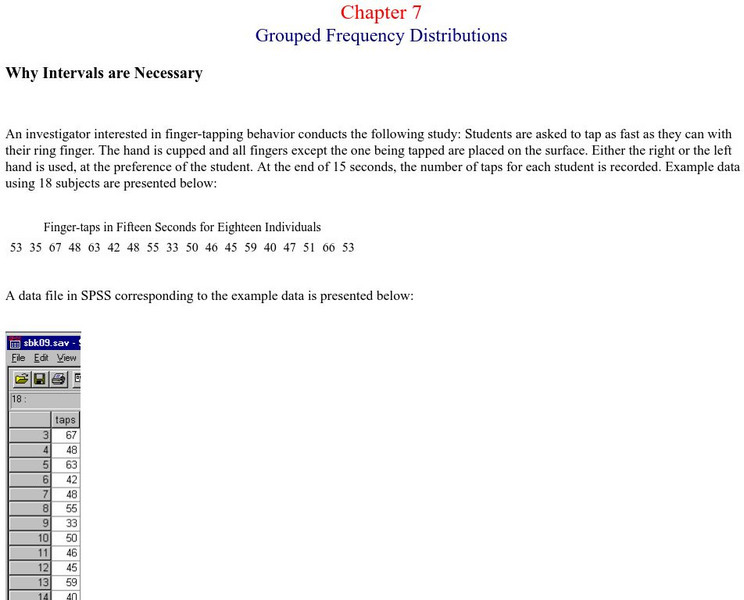
Missouri State Univ.: Introductory Statistics: Grouped Frequency Distributions
An example is provided for the explanation of grouped frequency distributions. Graphs show how to construct histograms and overlapping bell curves, and Excel documents are discussed as being useful here.
McGraw Hill
Glencoe: Self Check Quizzes 1 Frequency Tables
Use Glencoe's randomly generated self-checking quiz to test your knowledge of frequency tables. Each question has a "Hint" link to help. Choose the correct answer for each problem. At the bottom of the page click the "Check It" button...
CK-12 Foundation
Ck 12: Statistics: Ungrouped Data to Find the Mean
[Free Registration/Login may be required to access all resource tools.] Covers frequency distribution tables with ungrouped data.
CK-12 Foundation
Ck 12: Statistics: Grouped Data to Find the Mean
[Free Registration/Login may be required to access all resource tools.] Covers frequency distribution tables with grouped data.
Mangahigh
Mangahigh: Data: Use Frequency Tables
This site provides students practice with the concept of frequency tables. Students can learn about the topic by completing an interactive tutorial. Students can then take a ten question timed test to practice the skill.
Other
Online Statistics Education: Graphing Distributions [Pdf]
This is the second chapter of a statistics e-text developed collaboratively by Rice University, University of Houston Clear Lake, and Tufts University. It looks at many different types of data displays and the advantages and...
Khan Academy
Khan Academy: Two Way Frequency Tables
Given a Venn diagram or information about a relationship, create a two-way frequency table. Students receive immediate feedback and have the opportunity to try questions repeatedly, watch a video, or receive hints.
Khan Academy
Khan Academy: Two Way Relative Frequency Tables
Practice creating two-way relative frequency tables from a two-way frequency table. Students receive immediate feedback and have the opportunity to try questions repeatedly, watch a video, or receive hints.
Khan Academy
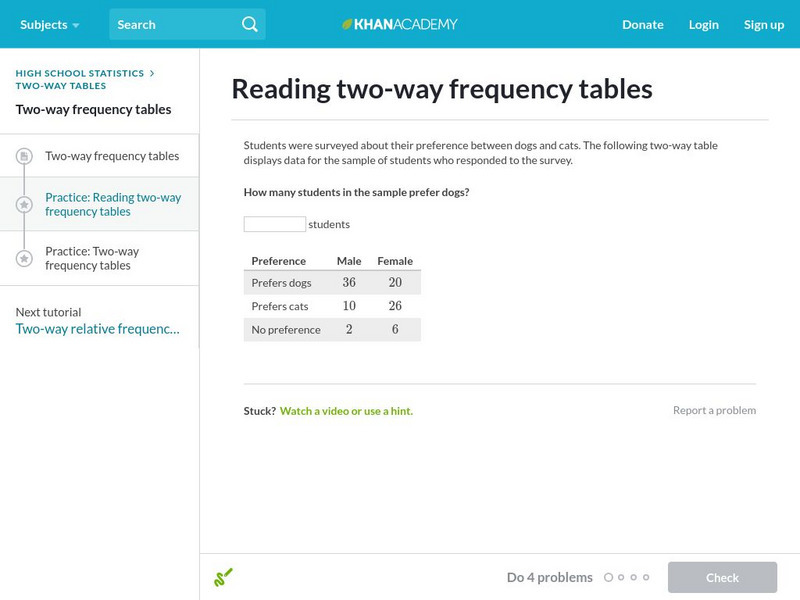
Khan Academy: Reading Two Way Frequency Tables
Practice interpreting two-way frequency tables. For example, what does the cell in the top left tell you? Students receive immediate feedback and have the opportunity to try questions repeatedly, watch a video, or receive hints.
Khan Academy
Khan Academy: Interpreting Two Way Tables
Do you understand how two-way tables really work? Here's your chance to practice. Students receive immediate feedback and have the opportunity to try questions repeatedly, watch a video, or receive hints.
Khan Academy
Khan Academy: Dot Plots and Frequency Tables Review
Dot plots and frequency tables are tools for displaying data in a more organized fashion. In this article, we review how to make dot plots and frequency tables.


