Hi, what do you want to do?
Houghton Mifflin Harcourt
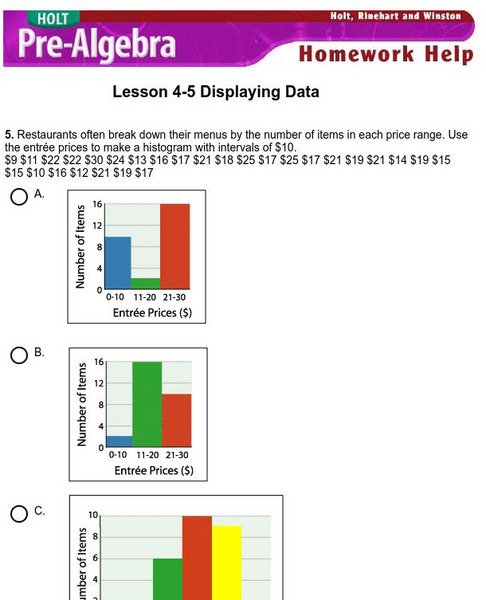
Holt, Rinehart and Winston: Homework Help Independent Practice: Displaying Data
Get independent practice displaying data. Each incorrect response gets a text box explanation and another try. Correct responses are confirmed.
Khan Academy
Khan Academy: Calculating the Median: Data Displays
Practice computing the median of data sets presented in a variety of formats, such as frequency tables and dot plots. Students receive immediate feedback and have the opportunity to try questions repeatedly, watch a video or receive hints.
Cuemath
Cuemath: Frequency Distribution Table
A comprehensive guide for learning all about frequency distribution tables with definitions, how to create a frequency distribution table, and the formulas and graphs related to frequency distributions. With solved examples and...
CK-12 Foundation
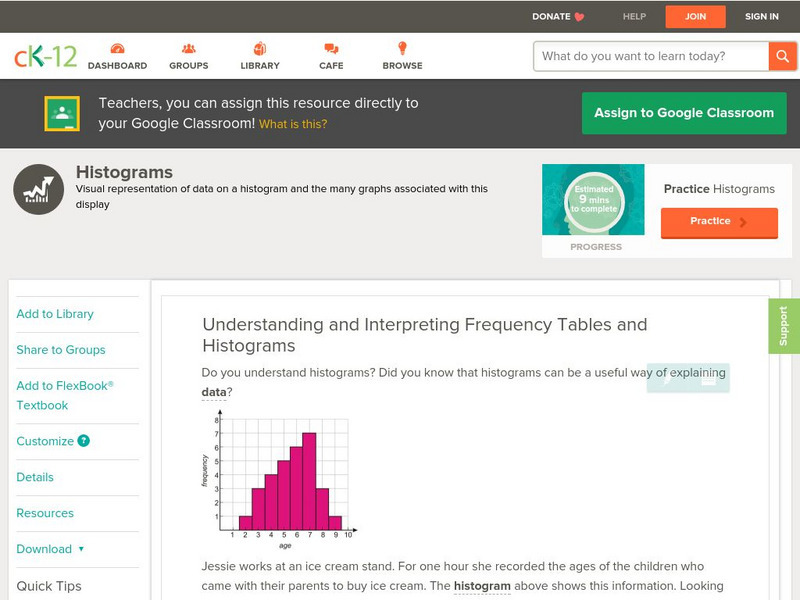
Ck 12: Statistics: Histograms Grade 8
[Free Registration/Login may be required to access all resource tools.] Students will interpret frequency tables and connect data to histograms.
Mangahigh
Mangahigh: Data: Find the Class Interval Containing the Mode
Students watch an online tutorial on the concept of finding mode from a frequency table. After watching, students test their knowledge by attempting ten practice problems that increase or decrease in difficulty based on their answers.
Oswego City School District
Regents Exam Prep Center: Practice With Organizing and Interpreting Data
Several problems are presented to test your skills in creating and interpreting frequency tables, pie charts, box-and-whisker and stem-and-leaf plots.
Other
Stat Trek: Two Way Tables
This website provides students instruction on how to construct and interpret two-way tables.
CK-12 Foundation
Ck 12: Statistics: Histograms Grades 11 12
[Free Registration/Login may be required to access all resource tools.] This Concept covers making frequency tables and using them to create a histogram.
Texas Instruments
Texas Instruments: Two Way Tables
This set contains statistics questions regarding two-way tables, marginal frequencies, and Simpson's paradox. The student gives an in-context interpretation to a row or column relative frequency expressed as a percent.
McGraw Hill
Glencoe: Two Way Tables [Pdf]
This portion of an online textbook provides examples of two-way tables, vocabulary and practice problems.
E-learning for Kids
E Learning for Kids: Math: Tea Store: Reading a Table
Students will demonstrate how to interpret information in a table.
Louisiana Department of Education
Louisiana Doe: Louisiana Believes: Eureka Math Parent Guide: Collecting and Displaying Data
A guide to support parents as they work with their students in collecting and displaying data.
Other
Online Statistics Education: Graphing Distributions [Pdf]
This is the second chapter of a statistics e-text developed collaboratively by Rice University, University of Houston Clear Lake, and Tufts University. It looks at many different types of data displays and the advantages and...
Khan Academy
Khan Academy: Interpreting Two Way Tables
Do you understand how two-way tables really work? Here's your chance to practice. Students receive immediate feedback and have the opportunity to try questions repeatedly, watch a video, or receive hints.
CK-12 Foundation
Ck 12: Statistics: Histograms Grade 7
[Free Registration/Login may be required to access all resource tools.] Make a histogram given a frequency table.
Better Lesson
Better Lesson: Class Surveys and Graphs
Young scholars love graphing data that they "own". In this plan, the class will select a type of graph and create it using a class survey frequency table. Included in this instructional activity are videos of the class engaged in the...
BBC
Bbc: Bitesize Revision: Data Handling: Mean
Need the basics on how to find a mean? Interactive examples are available that help you find the mean using data from a frequency table. You can also enter your own data and find the mean. You will find plenty of guided practice and...
Oswego City School District
Regents Exam Prep Center: Central Tendency: Mean, Mode, Median
This tutorial discusses mean, median, and mode. It introduces the frequency table and gives several examples. A practice page is included and a teacher resource page that contains an activity using manipulatives.
Math Is Fun
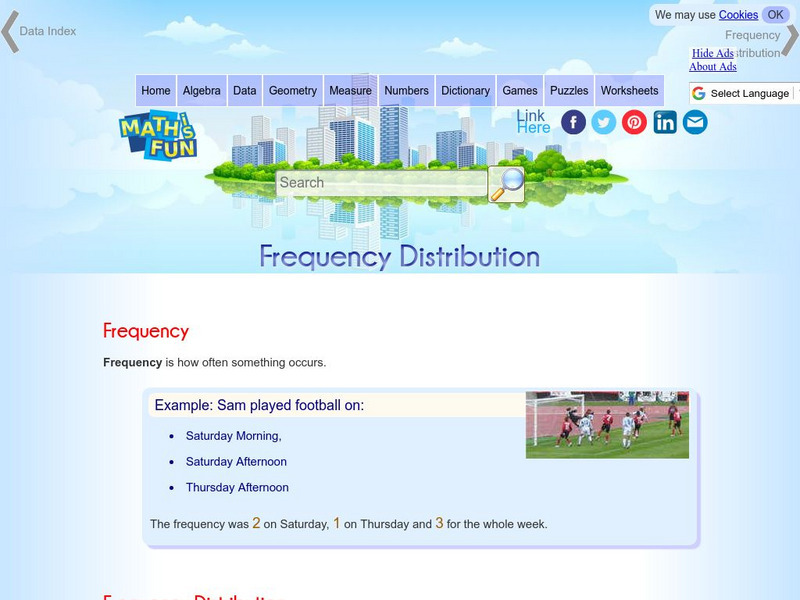
Math Is Fun: Frequency Distribution
Explains, with examples, what a frequency distribution table is. Includes a set of practice questions.
Khan Academy
Khan Academy: Two Way Tables Review
Two-way tables organize data based on two categorical variables.
McGraw Hill
Glencoe: Online Study Tool: Quiz on Measures of Variability
Students demonstrate advanced mathematics skills with this online quiz. The questions check understanding on measures of variability. Topics include variance, standard deviation, and frequency tables.
Palomar Community College District
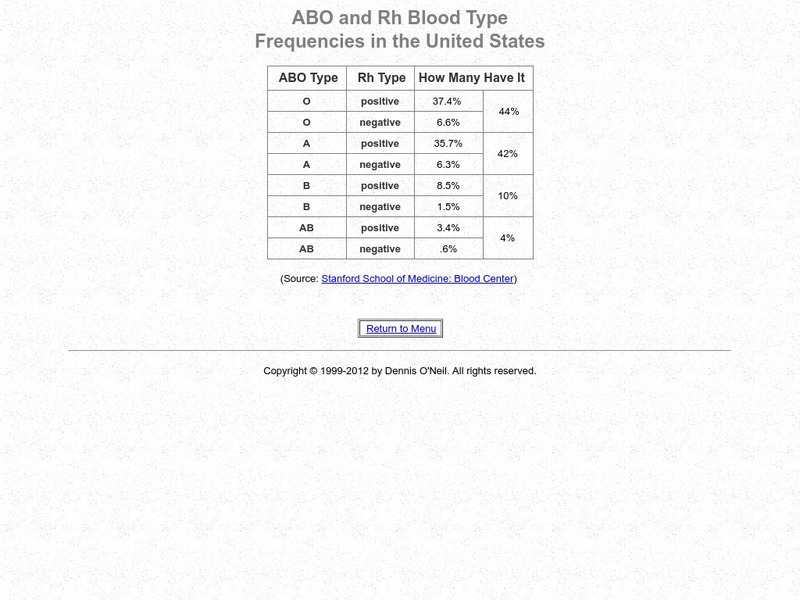
Palomar College: Table of Blood Type Frequencies
This site includes a listing of United States frequencies of the various human blood groups.
Palomar Community College District
Palomar College: Frequency Polygon an Example
A step-by-step worked problem demonstrating how to take a set of data and produce a frequency polygon. Hints are provided along the way and the final graph is shown for the user to check.
Alabama Learning Exchange
Alex: Great Golly Graphs
This lesson plan asks middle schoolers to create a survey project including graphs, questions, tables, and data analysis. It gives an assessment and ideas for remediation and extension as well as ways to manage behavior problems and...
Other popular searches
- Frequency Tables Line Plots
- Math Frequency Tables
- Making Frequency Tables
- Reading Frequency Tables
- Creating Frequency Tables
- Cumulative Frequency Tables
- Frequency Tables 7th Grade
- Intro to Frequency Tables
- Making Frequency Tables Quiz






![Glencoe: Two Way Tables [Pdf] eBook Glencoe: Two Way Tables [Pdf] eBook](https://content.lessonplanet.com/knovation/original/108238-00003273f53572e51290174e1a53eb12.jpg?1661187814)

