Hi, what do you want to do?
Illustrative Mathematics
Illustrative Mathematics: S Cp How Do You Get to School?
All of the upper-division students (juniors and seniors) at a high school were classified according to grade level and response to the question "How do you usually get to school?" The resulting data are summarized in a two-way table and...
Mangahigh
Mangahigh: Data: Find the Mode
Students learn about the concept of mode by exploring a tutorial. They can then test their knowledge by taking a ten question assessment that increases in difficulty as they correctly answer questions.
Oswego City School District
Regents Exam Prep Center: Categorizing Data
Three lessons on different types of data (qualitative, quantitative, univariate, bivariate, biased data) as well as a practice activity and teacher resource.
National Council of Teachers of Mathematics
Nctm: Figure This: How Much Time Do Teens Spend on the Job?
Try this math challenge where you investigate the average number of hours teen actually spend working. Apply your problem solving, number sense, and computation skills in this one page activity from the NCTM Math Challenges for Families...
Science Struck
Science Struck: Wavelength of Light
Describes the characteristics of light, presents two formulas for calculating its wavelength, and provides a table of the different wavelength ranges across the electromagnetic spectrum.
Richland Community College
Richland Community College: Stats Graphs Defined
Richland Community College provides a glossary of many terms that are needed in order to understand statistics graphs and charts. Each of the types of charts is quickly explained in terms of what it is most effective in displaying.
Khan Academy
Khan Academy: Comparing Data Displays
Practice interpreting and comparing dot plots, histograms, and box plots. Students receive immediate feedback and have the opportunity to try questions repeatedly, watch a video or receive hints.
Khan Academy
Khan Academy: Conditional Distributions and Relationships
A small private college was curious about what levels of students were getting straight A grades. College officials collected data on the straight A status from the most recent semester for all of their undergraduate and graduate students.
Missouri State University
Missouri State U.: Introductory Statistics: Concepts, Models, and Applications
This is a comprehensive online text about statistics which covers all the basic concepts.
Cuemath
Cuemath: Histograms
A comprehensive guide for learning all about histograms with definitions, solved examples, and practice questions.
Texas Instruments
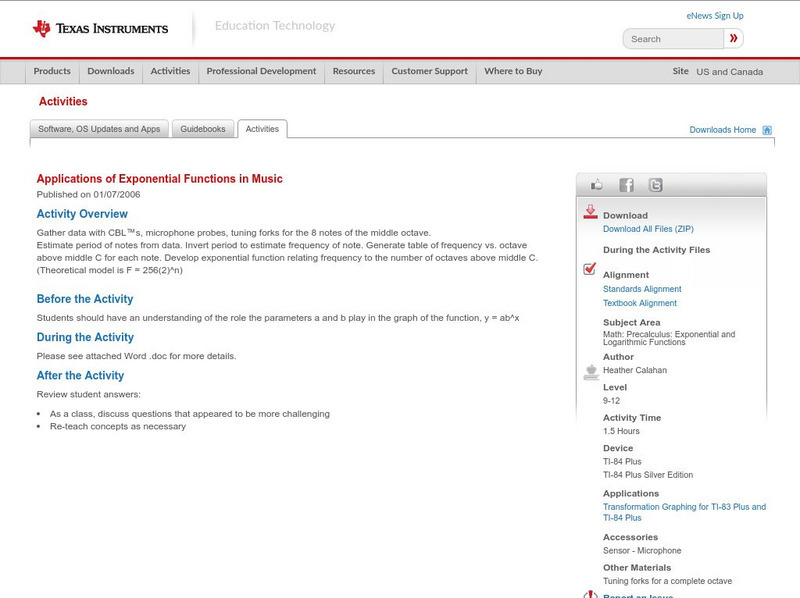
Texas Instruments: Applications of Exponential Functions in Music
In this lesson students will gather data on various tones and estimate frequency while creating a table of frequency vs. octave.
CK-12 Foundation
Ck 12: Plix: Genetic Linkage
[Free Registration/Login Required] Use the recombinant frequencies in the table to determine where the genes are located in the table. You will need a sign-in to access this interactive but it will be well worth your time!
CK-12 Foundation
Ck 12: Types of Data Representation: Graphic Displays of Data
[Free Registration/Login may be required to access all resource tools.] Here you will explore displays of data using bar charts, histograms, pie charts and boxplots, and learn about the differences and similarities between them and how...
Science Struck
Science Struck: Richter Scale Explained
Explains what the Richter scale is and how the Richter formula is used to measure the magnitude of earthquakes. Includes a table of Richter values showing the changes in characteristics, impact, and frequency of tremors and earthquakes...
University of Illinois
University of Illinois: Rollin' Rollin' Rollin'
This resource is the beginning of a series of pages that demonstrates the diffference between the mean and median of a group of numbers. Uses bar graphs to display the data.
Other popular searches
- Frequency Tables Line Plots
- Math Frequency Tables
- Making Frequency Tables
- Reading Frequency Tables
- Creating Frequency Tables
- Cumulative Frequency Tables
- Frequency Tables 7th Grade
- Intro to Frequency Tables
- Making Frequency Tables Quiz


