CK-12 Foundation
Ck 12: Algebra: Using Functions to Describe a Situation
[Free Registration/Login may be required to access all resource tools.] Students learn to write a function rule from a table of values and represent real-world situations with a function. Students examine guided notes, review guided...
Khan Academy
Khan Academy: Evaluate Composite Functions: Graphs & Tables
Given the graphs, or some tables of values, of two functions, evaluate the composition of those functions at a given input.
Khan Academy
Khan: Lsn 8: Interpreting Relationships in Scatterplots/graphs/tables/equations
This lesson focuses on Interpreting and analyzing linear, quadratic, and exponential models and graphs. Students will use best fit lines to interpret contexts, distinguish whether contexts are linear or exponential functions, use the...
Microsoft
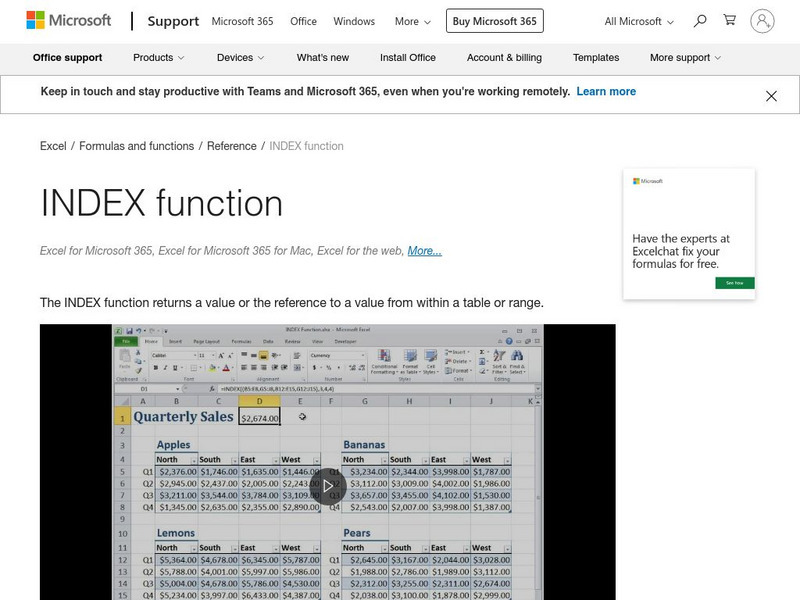
Microsoft: Index Function
Learn about the INDEX function that returns a value or the reference to a value from within a table or range.
Windstream
Ojk's Precalculus Study Page: Quadratic Functions: Graphs
A tutorial devoted to the steps used to graph a quadratic function. Includes tables, graphs, and several sample problems.
Simon Fraser University
Chem1 Virtual Textbook: Physical Significance of the Wave Function
Acting as a subtopic of the General Chemistry Virtual Textbook's section on Atoms and the Periodic Table, this site discusses the wave function in relation to orbitals and continual waves.
Illustrative Mathematics
Illustrative Mathematics: F Le Boiling Water
Young scholars are shown two tables of data showing the approximate boiling point of water at different elevations. Both data sets can be modeled by linear functions but with different slopes. When the tables are combined, however,...
Illustrative Mathematics
Illustrative Mathematics: F Le Us Population 1982 1988
In this task, students are shown a table of U.S. population data between 1982 and 1988 and are asked to explore whether linear functions would be appropriate to model relationships within the data. Aligns with F-LE.B.5 and F-LE.A.1.b.
Illustrative Mathematics
Illustrative Mathematics: F Le Choosing an Appropriate Growth Model
The goal of this task is to examine some population data for large cities from a modeling perspective. Students are asked to decide if the population data can be accurately modeled by a linear, quadratic, and/or exponential function, and...
Illustrative Mathematics
Illustrative Mathematics: F if a Sse Modeling London's Population
In this task, students are shown a table of population data for the city of London and are asked to explore whether a linear, quadratic, or exponential function would be appropriate to model relationships within the data. They are next...
Illustrative Mathematics
Illustrative Mathematics: F Le Us Population 1790 1860
In this task, young scholars are shown a table of U.S. population data between 1790 and 1860 and are asked to explore whether exponential functions would be appropriate to model relationships within the data. The purpose of the task is...
Illustrative Mathematics
Illustrative Mathematics: F Le Basketball Bounces, Assessment Variation 2
This task asks students to analyze a set of data about the height of a basketball for each time it bounces. They choose a model that reasonably fits the data and use the model to answer questions about the physical context. This second...
Simon Fraser University
Chem1 Virtual Textbook: Emission and Absorption Spectra
Acting as a subtopic of the General Chemistry Virtual Textbook's section on Atoms and the Periodic Table, this site specifically discusses emission and absorption spectra in relation to the Bohr model.
Illustrative Mathematics
Illustrative Mathematics: F If.6 Mathemafish Population
For this task, students are presented with a table and a graph and are asked to summarize the data and report the findings of a project by the Environmental Protection Agency to contain the effects of an invasive species on a fish...
Other popular searches
- Function Tables 5th Grade
- Function Tables and Graphs
- Algebra Function Tables
- Function Tables Word Problems
- Linear Function Tables
- Patterns and Function Tables
- Graph Function Tables
- Math Function Tables
- Function Tables and Algebra
- Nd Function Tables
- Graphing Function Tables
- Function Tables Ell
