Hi, what do you want to do?
Khan Academy
Khan Academy: Rates and Proportional Relationships
A variety of questions about rates and proportional relationships involving graphs, tables, and equations. Students receive immediate feedback and have the opportunity to try questions repeatedly, watch a video, or receive hints.
Purple Math
Purplemath: Exponential Functions: Introduction
Purplemath offers tables and graphs of various exponential functions for an exploration of how exponential functions behave from the real number domain. Compound interest problems are examined and the natural exponential is discussed...
California State University
California State University, San Bernardino: Inverse Functions
This site has many links to examples of inverse functions, including intersections, inverse by reflection, and graphing inverse functions.
Texas Instruments
Texas Instruments: C Ds Anyone?
In this activity, students write rules for real world functions. They make a table to compare function values and graph linear functions on the coordinate plane.
Texas Instruments
Texas Instruments: Walking the Line
In this activity, students use linear functions to model and solve problems in situations with slope and a constant rate of change. They learn to represent situations with variables in expressions, equations, and inequalities and use...
Khan Academy
Khan Academy: Average Rate of Change: Graphs and Tables
Find a function's average rate of change over a specific interval, given the function's graph or a table of values. Students receive immediate feedback and have the opportunity to try questions repeatedly or receive hints.
CK-12 Foundation
Ck 12: Algebra: Input Output Tables for Function Rules
[Free Registration/Login may be required to access all resource tools.] Evaluate a function rule by finding outputs for a given input
CK-12 Foundation
Ck 12: Algebra: Domain and Range of a Function
[Free Registration/Login may be required to access all resource tools.] Find the domain and range of a function and make a table of values for a function.
Illustrative Mathematics
Illustrative Mathematics: F if the Customers
This is a beginning lesson on the concept of functions. The context is a business that has a database of customer names and phone numbers in a table and students must decide if a function is involved. Aligns with F-IF.A.1 and 8.F.A.1.
Texas Education Agency
Texas Gateway: Determining Slopes From Equations, Graphs, and Tables
Given algebraic, tabular, and graphical representations of linear functions, the student will determine the slope of the relationship from each of the representations.
Khan Academy
Khan Academy: Evaluate Composite Functions: Graphs & Tables
Given the graphs, or some tables of values, of two functions, evaluate the composition of those functions at a given input.
Khan Academy
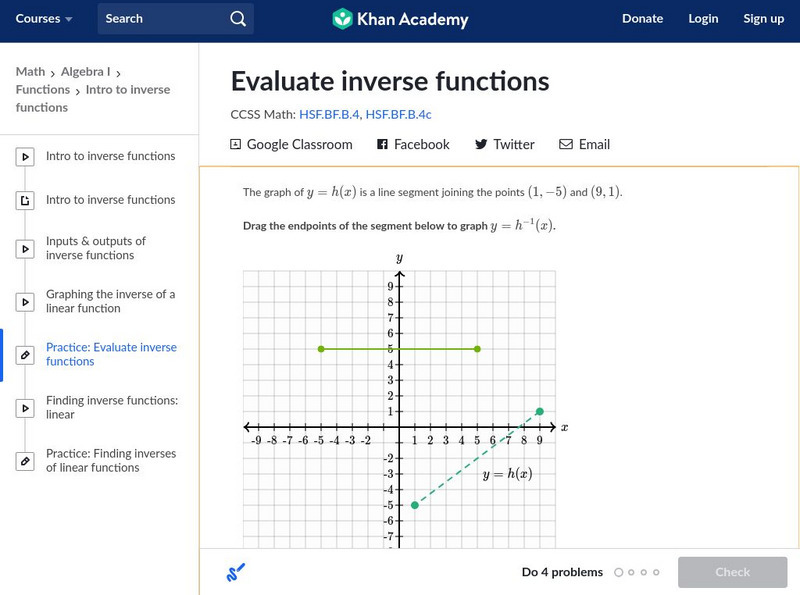
Khan Academy: Algebra I: Evaluate Inverse Functions
Practice evaluating the inverse function of a function that is given either as a formula, or as a graph, or as a table of values. Students receive immediate feedback and have the opportunity to try questions repeatedly, watch a video or...
CK-12 Foundation
Ck 12: Algebra: Graphs of Linear Equations
[Free Registration/Login may be required to access all resource tools.] Students learn how to graph linear equations. Students examine guided notes, review guided practice, watch instructional videos and attempt practice problems.
CK-12 Foundation
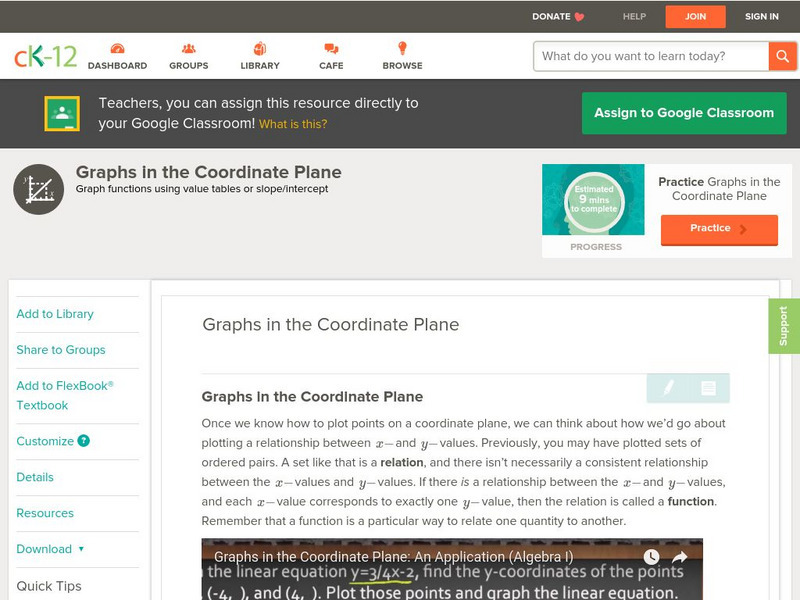
Ck 12: Algebra: Graphs in the Coordinate Plane
[Free Registration/Login may be required to access all resource tools.] Students learn to use tables of values and rules to graph functions. Students examine guided notes, review guided practice, watch instructional videos and attempt...
Sophia Learning
Sophia: Graphing Square Root Function
Create a table of values to graph a square root function and identify the domain and the range.
Alabama Learning Exchange
Alex: Math Is Functional
This lesson is a technology-based activity in which students extend graphing of linear functions to the use of spreadsheet software. After students have become proficient in constructing a table of values, students are able to...
Windstream
Ojk's Precalculus Study Page: Quadratic Functions: Graphs
A tutorial devoted to the steps used to graph a quadratic function. Includes tables, graphs, and several sample problems.
Texas Instruments
Texas Instruments: Functions, Graphs, and Limits
In this activity, students create graphs and tables of values for functions. They can use this graphical and numerical information to explore limits. Students can also evaluate limits directly.
Mangahigh
Mangahigh: Algebra: Recognize Common Straight Line Graphs
Mangahigh is a website with math games aimed at twelve to eighteen year olds. On this site students draw and recognize lines without the need to construct a table of values.
Rice University
Rice University: Cynthia Lanius: Fun and Sun Rent a Car
A wide range of math skills is incorporated into a lesson that involves planning a family's vacation to Florida. Travel expenses are gathered and compared, graphed, and analyzed in hopes of finding the best prices. There are extension...
Shodor Education Foundation
Shodor Interactivate: Two Variable Function Pump
Enter two complex numbers (z and c) as ordered pairs of real numbers, then click a button to iterate step by step. The iterates are graphed in the x-y plane and printed out in table form.
ClassFlow
Class Flow: Graphing Inequalities
[Free Registration/Login Required] Students represent functional relationships using tables, equations, and graphs, and describe the connection among these representations.
Houghton Mifflin Harcourt
Houghton Mifflin Harcourt: Saxon Activity Center: Graphing Calculator Activity: Average [Pdf]
A concise graphing calculator lesson on calculating average. Detailed examples, demonstrations of calculator functions, and practice problems included. Acrobat Reader required.
Texas Instruments
Texas Instruments: Getting Started With the Ti Navigator: Quadratic Equations
This lesson introduces students to Activity Center and is intended to help students write systems of equations in standard form in slope intercept form to solve the system using tables and graphs.


