Hi, what do you want to do?
Curated OER
Recycling Statistics
For this environment worksheet, students look for the answers to the environmental impact of recycling in Great Britain with the statistics from the pie graph.
Curated OER
Creating Open-ended Problems in Algebra
Creating open-ended algebra problems can help students develop the critical thinking skills they need.
Curated OER
Cinderbank
Fourth graders identify major components of a "Cinderella" story in order to create a database.
Curated OER
EOCT Practice 1
In this Algebra I worksheet, 9th graders solve practice problems in preparation for the end of course testing. The one page worksheet contains twenty multiple choice questions. Answers are provided.
Curated OER
United States Population: Using Quadratic Models
In this United States population worksheet, students solve word problems about the United States population by using the quadratic formula. Students complete 6 problems.
Curated OER
Little Red Corvette
Students investigate the acceleration of a car. In this acceleration of a car lesson, students make a scatter plot of corvette acceleration data. Students find a model to fit the data by taking the integral of the curve...
Curated OER
Looking For Triangles
Students solve problems with triangles. In this geometry lesson, students analyze shapes to find different triangles. They name the shapes created by putting triangles together.
Curated OER
Foreign Stamps
Eighth graders convert the price of US stamps to those of a number of foreign currencies. They use conversion charts to make the changes.
Curated OER
Watershed Management
Students investigate the concept of a watershed. They conduct research into the concept using a variety of resources. Students take a field trip to a local watershed to make observations. The outcome is a report concerning the outside...
CK-12 Foundation
Ck 12: Function Rules for Input Output Tables: Soda Sugar Function Table
[Free Registration/Login Required] Students are given an input/output table and are to determine the inputs and write rules for the function. Click 'Challenge Me' to answer practice questions and click 'Learn More' for more information...
Khan Academy
Khan Academy: Algebra I: Exponential Functions From Tables & Graphs
Write exponential functions of the basic form f(x)=a * b squared, either when given a table with two input-output pairs, or when given the graph of the function. Students receive immediate feedback and have the opportunity to try...
CK-12 Foundation
Ck 12: Algebra: Graphs of Linear Equations
[Free Registration/Login may be required to access all resource tools.] Students learn to use a table to graph functions recognizing linear equations and the equations of horizontal lines and vertical lines. Students examine guided...
Texas Education Agency
Texas Gateway: Direct Variation and Proportional Change
The student will use a variety of methods inculding tables, equations and graphs to find the constant of variation and missing values when given a relationship that varies directly.
Khan Academy
Khan: Lsn 8: Interpreting Relationships in Scatterplots/graphs/tables/equations
This lesson focuses on Interpreting and analyzing linear, quadratic, and exponential models and graphs. Students will use best fit lines to interpret contexts, distinguish whether contexts are linear or exponential functions, use the...
Texas Instruments
Texas Instruments: From Tables to Graphs
Students learn how to generate a table of values showing the accumulated amounts of a sum of money compounded over n periods. They graph these values and learn how to determine the accumulated amount corresponding to any given period.
University of Texas at Austin
Mathematics Teks Toolkit: Making Connections
In this lesson, students will use input/output tables to explore functions, equations, and graphs.
Other
Nearpod: Graphing Equations Using a Table
In this lesson on graphing equations using a table, students will learn how to create a table for a function in terms of domain and range and then graph the function on the coordinate plane.
Texas Instruments
Texas Instruments: Accumulation Functions
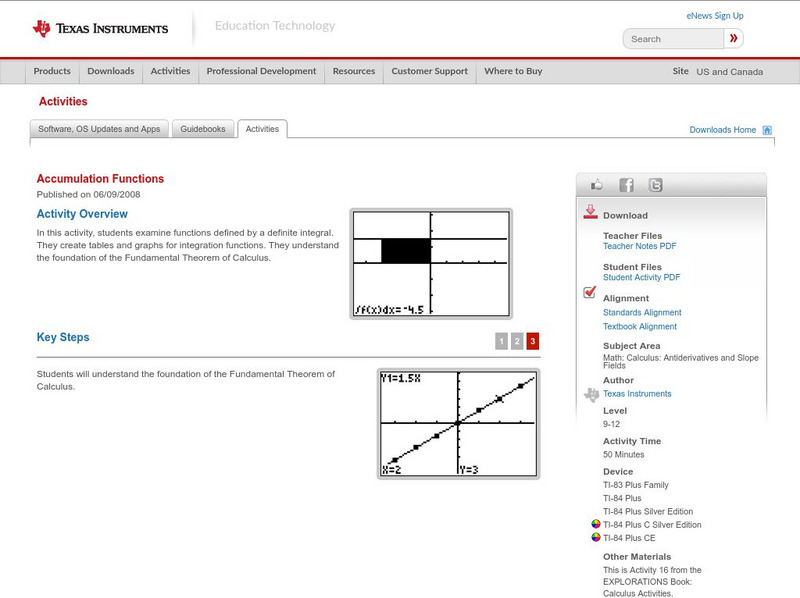
In this activity, students examine functions defined by a definite integral. They create tables and graphs for integration functions. They understand the foundation of the Fundamental Theorem of Calculus.
Texas Education Agency
Texas Gateway: Connecting Multiple Representations of Functions
The student will consider multiple representations of linear functions, including tables, mapping diagrams, graphs, and verbal descriptions.
Texas Education Agency
Texas Gateway: Functions and Their Inverses
Given a functional relationship in a variety of representations (table, graph, mapping diagram, equation, or verbal form), the student will determine the inverse of the function.
Khan Academy
Khan Academy: Recognize Functions From Tables
Determine whether a table of values of a relationship represents a function. Students receive immediate feedback and have the opportunity to try questions repeatedly, watch a video or receive hints.
Other
Limits a Geometric and Numeric Approach
Students learn about limits using geometric and numeric approaches. Topics include limits using tables and limits with graphs. The resource consists of graphs, examples, and a learning game.
PBS
Pbs: Comparing Exponential, Quadratic, and Linear Functions
Analyze the numerical and graphical representations of functions. This interactive exercise focuses comparing linear, quadratic, and exponential functions and their graphical representations after completing a table to calculate ordered...


