Hi, what do you want to do?
Texas Instruments
Texas Instruments: Limits, Numerically
This activity introduces limits, numerically using tables and graphs.
Texas Instruments
Texas Instruments: Understanding Limits
This activity is designed to show students how to use a graphing calculator to find a limit by graphing, investigating a table, and by using the calc menu. (Continued. See "before the activity.")
Khan Academy
Khan Academy: Intercepts From a Table
Find the intercepts of a line given a table of values. Students receive immediate feedback and have the opportunity to try questions repeatedly, watch a video, or receive hints.
Texas Instruments
Texas Instruments: The Quest for Roots of Higher Order Equations
Students learn how to approximate the roots of any polynomial equation of any order by first using tables, and then by tracing along the graph to the point where the curve intersects
PBS
Wnet: Thirteen: Math in Basketball: Lesson Plan
In this lesson plan, students will explore ways that mathematics are used in basketball. Students will explore the concept of a function and will learn to use function notation. Students will recognize, describe, and represent quadratic...
CK-12 Foundation
Ck 12: Algebra: Functions on a Cartesian Plane
[Free Registration/Login may be required to access all resource tools.] Students learn to graph a function represented by a table of values in the coordinate plane. Students examine guided notes, review guided practice, watch...
Math2
Math2.org: Trigonometry Tables
Three trig tables are provided for student and teacher reference. The first table lists the sine, cosine, tangent, secant, cosecant, and cotangent values of all whole-number angles from 0 to 90. The radian equivalent (to four decimals)...
Khan Academy
Khan Academy: Even and Odd Functions: Graphs and Tables
Given the graph of a function, determine if it's even, odd, or neither.
ClassFlow
Class Flow: Three Views of a Function
[Free Registration/Login Required] Using this flipchart, students will graph a function and create a table from a rule and a graph.
University of Texas
Inside Mathematics: Granny's Balloon Trip [Pdf]
This task challenges a student to use knowledge of scale to organize and represent data from a table on a graph.
Other
The Actuarial Foundation: Math Academy: Can You See It in Nature? [Pdf]
Students will build, extend, describe, predict, graph and generate rules for patterns and functions designed to help students understand the connection between geometric and numerical patterns (younger students) as well as between...
Illustrative Mathematics
Illustrative Mathematics: F If.6 Mathemafish Population
For this task, students are presented with a table and a graph and are asked to summarize the data and report the findings of a project by the Environmental Protection Agency to contain the effects of an invasive species on a fish...
Mangahigh
Mangahigh: Algebra: Draw Straight Lines Using Alternative Linear Formats
This interactive media source has two parts a learning mode and a practice game mode. The learning mode is where students are guided through understanding concepts of linear functions. Next, students play a game where they are asked...
Illustrative Mathematics
Illustrative Mathematics: 8.f Us Garbage, Version 1
Eighth graders work with input values (the year) and output values (the amount of garbage that year) in a table about the garbage produced in the US. They study the table to answer specific questions, state whether it represents a linear...
CK-12 Foundation
Ck 12: Using the First and Second Derivative Tests
[Free Registration/Login may be required to access all resource tools.] This resource gives a step by step account of how to apply knowledge from First and Second Derivative Tests to sketch graphs of functions. The following table...
Other
Stat Soft: Statistics Glossary
Dozens of statistical terms are defined and illustrated in this glossary.
Texas Instruments
Texas Instruments: Where Should They Hold the Fundraising Party?
Students learn how to create a table of values for a simple linear function and use the table to create a graph on squared paper. They use the graphing calculator to display the ordered pairs and find values of corresponding to values of...
Illustrative Mathematics
Illustrative Mathematics: F Bf Latitude
For this task, students are presented with data about latitude and the percentage of the Earth's surface north of each latitude line. They are to use this data to sketch a graph, analyze it, and build an understanding of an invertible...
Math2
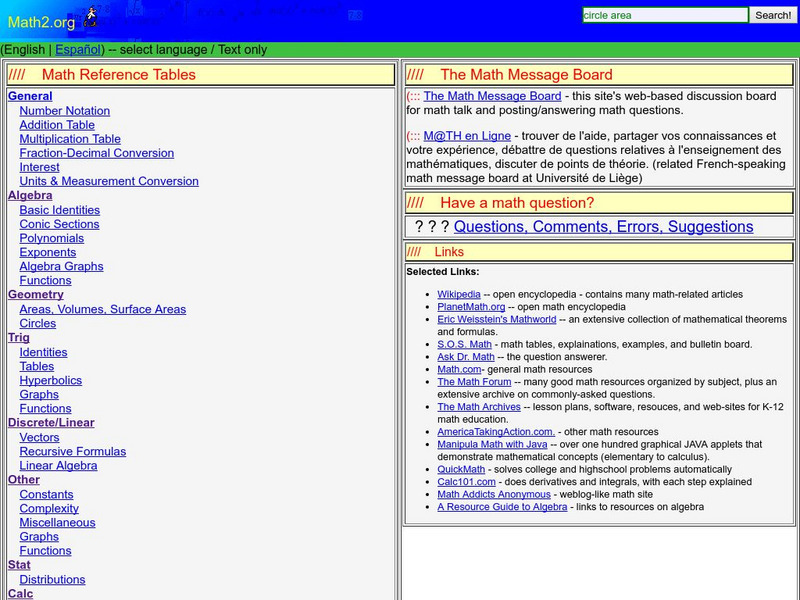
Math2
This is a site for students and teachers of all grade levels. If you are looking for math tables, general information about math topics, or you would like to ask a question, this is the site to visit.
CK-12 Foundation
Ck 12: Statistics: Basic Graph Types
[Free Registration/Login may be required to access all resource tools.] Organize distributions of data by using a number of different methods.
Texas Instruments
Texas Instruments: Social Security Issues
In this activity, you will look at the relationship between the age at which you start drawing social security and the amount drawn. Both graphs and spreadsheets will be used.
Texas Instruments
Texas Instruments: Getting Started With the Ti Navigator System: River of Life
This lesson introduces students to Activity Center and is intended to help students develop the conceptual understanding of how to identify functions as linear or nonlinear and contrast their properties from tables, graphs, or equations.
Texas Instruments
Texas Instruments: Math Today Challenge New Color of Money
In this activity, students will read about the changes in the "new money" and then create a graph to represent various combinations of currency produced. This activity provides an excellent example of discrete, real-world data.
Illustrative Mathematics
Illustrative Mathematics: F if a Sse Modeling London's Population
In this task, students are shown a table of population data for the city of London and are asked to explore whether a linear, quadratic, or exponential function would be appropriate to model relationships within the data. They are next...





![Inside Mathematics: Granny's Balloon Trip [Pdf] Lesson Plan Inside Mathematics: Granny's Balloon Trip [Pdf] Lesson Plan](https://static.lp.lexp.cloud/images/attachment_defaults/resource/large/FPO-knovation.png)
