Hi, what do you want to do?
EngageNY
The Graph of a Function
Mathematics set notation can be represented through a computer program loop. Making the connection to a computer program loop helps pupils see the process that set notation describes. The activity allows for different types domain and...
Curated OER
Mooring Mobiles Lab
Oceanography experts use candy to construct a model of a bio-physical mooring that would test a variety of factors. Each piece of equipment to be included on the mooring is described within the write-up. As pupils gather the candies for...
Virginia Department of Education
Linear Modeling
An inquiry-based algebra lesson explores real-world applications of linear functions. Scholars investigate four different situations that can be modeled by linear functions, identifying the rate of change, as well as the...
Curated OER
Functional Analysis
Students perform functional analysis. In this pre-calculus lesson, students recognize the different elements of a function, graph a function and analyze it. They synthesize composites of other basic functions.
Curated OER
Functions and Their Graphs.
Students solve equations and label it as a function or not. In this algebra instructional activity, students make a table of values and graph their equation. They identify the domain and range of each graph.
Curated OER
Graphing Square Root and Other Radical Functions
In this worksheet, students graph the square root and other radical functions by examining the parent function and the translations and shifts that occur within the function family. The two page worksheet contains twelve problems.
Curated OER
Slope
Students calculate the slope of a line. For this slope lesson, students use a graph, an equation or two points to help them calculate the slope of a line. They differentiate between a slope of zero and an undefined slope.
Curated OER
Data Collection and Presentation
Students concentrate on discrete quantiative data. They are shown that the vertical line diagram as a more appropriate way to present discrete quantiative data then bar charts. Students work as a group to help with the interpretation...
Curated OER
Introduction To Functions
Students define a functions and solve problems using functions. In this algebra instructional activity, students differentiate functions from non-functions. They differentiate between polynomials of higher degrees.
Curated OER
How are we Related?
Students differentiate functions based on their domain and range. In this algebra lesson, students define function, domain, range and relation. They analyze graphs and coordinate pairs for input and output values making up a function.
Charleston School District
Increasing, Decreasing, Max, and Min
Roller coaster cars traveling along a graph create quite a story! The lesson analyzes both linear and non-linear graphs. Learners determine the intervals that a graph is increasing and/or decreasing and to locate maximum and/or...
EngageNY
The Graph of the Equation y = f(x)
Math language? Set notation is used in mathematics to communicate a process and that the same process can be represented as computer code. The concept to the loop in computer code models the approach pupils take when creating a solution...
Curated OER
Conics
In this precalculus worksheet, students find the equations that correspond to the conics. They apply concepts of applied mathematics to 2 detailed problems.
Curated OER
How Many Solutions 2
Students solve systems of equations. In this algebra lesson, students graph lines and identify the point of intersection. They identify the function to see if it is a function.
Curated OER
Basic Oscilloscope Operation
In this electrical worksheet, students answer a series of 25 questions about the use and understanding of an oscilloscope used by electrical technicians. This worksheet is printable and the answers are revealed on-line.
Curated OER
Three Digit Addition
In this math learning exercise, learners solve three digit addition problems. Some of the addition problems require regrouping. The problems are set up to solve vertically.
Curated OER
Roller Coaster Robot
Students calculate the area under a curve. In this calculus lesson, students use Riemann sums to find and approximate the area under a curve. They use the derivative and differential equations to solve.
Calvin Crest Outdoor School
Survival
Equip young campers with important survival knowledge with a set of engaging lessons. Teammates work together to complete three outdoor activities, which include building a shelter, starting a campfire, and finding directions in the...
Curated OER
Questionnaires and Analysis
Young scholars, review the techniques and different types of data analysis as well as how they are expressed, identify why facts and data are needed in conclusion of a questionnaire. The concepts of qualitative and quantitative data are...
Curated OER
Critical Points
High schoolers identify critical points on a graph. In this calculus lesson, students graph their equations on the TI calculator. They zoom in and out to identify the critical points.
Shodor Education Foundation
Shodor Interactivate: Vertical Line Test
Learn about the vertical line test for functions by trying to connect points in the plane to build a function. When you have connected all of the points, you will be told if your graph is a valid graph of a function.
Texas A&M University
Wtamu Virtual Math Lab: College Algebra: Domain, Range, Vertical Line Test
A detailed tutorial on functions covering the following topics: finding the domain and range of a function, using the vertical line test, determining whether a function is even, odd, or neither, and applying the greatest integer function...
Other
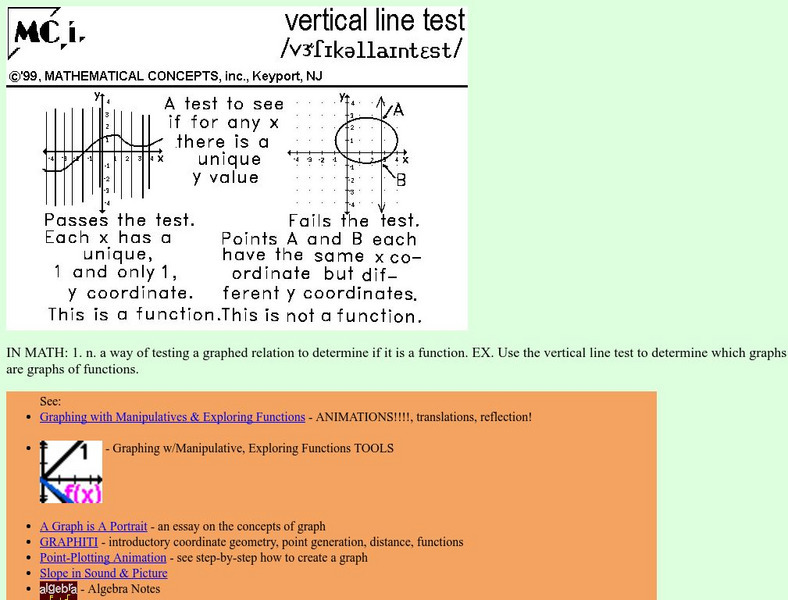
Mathn stuff.com: Vertical Line Test
Defines the vertical line test and provides a diagram showing graphs which pass and fail the test. Also provides several links for further information.
Cool Math
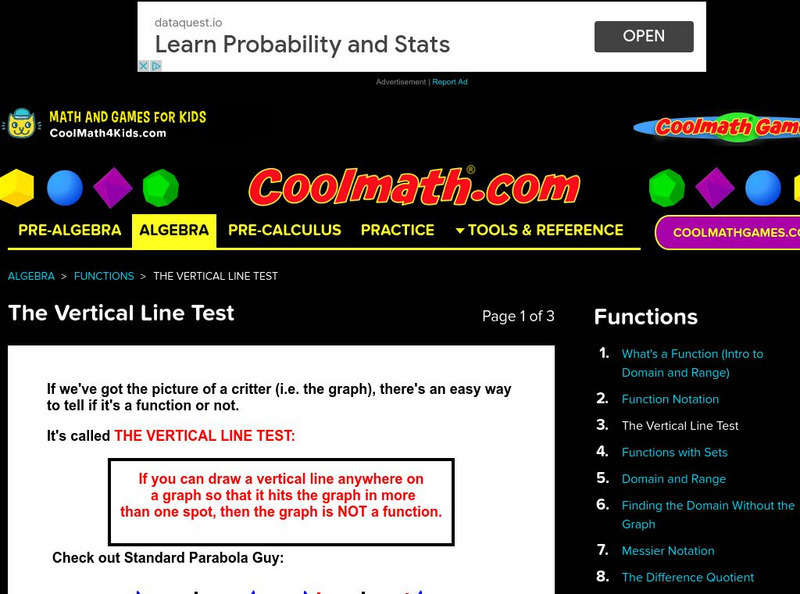
Coolmath: The Vertical Line Test
Explanation and examples for using the vertical line test.


