Curated OER
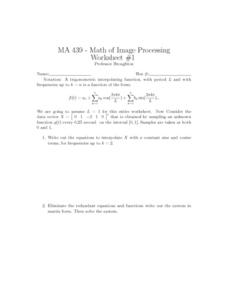
Interpolating Function
In this interpolating function activity, students solve 7 different sets of problems that include determining the interpolating function of each. They write out the equations to interpolate with a constant sine and cosine terms. Then,...
Curated OER
Organizing Data
In this organizing data worksheet, 7th graders solve seven different types of problems related to data. They first identify the type of data as categorical, discrete or continuous from the information given. Then, students use Excel to...
Curated OER
Move My Way: A CBR Analysis of Rates of Change
Learners match a given velocity graph and sketch the corresponding position graph using a graphing calculator. After collecting data from their everyday life, students use specific functions on their calculators to create graphs and...
Curated OER
Analyzing Data Sets
In this analyzing data sets worksheet, 11th graders solve and complete 35 various types of problems that include the analysis of data given. First, they determine the equation that best describes the data shown in a table. Then, students...
Curated OER
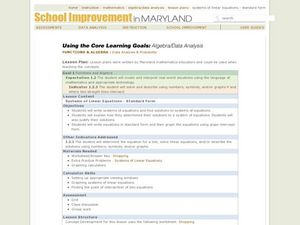
Functions & Algebra
Young scholars examine linear equations. For this functions and algebra lesson, students write equations in the slope-intercept form. They enter data in a graphing calculator, examine tables, and write linear equations to match the data.
Curated OER
Relations and Functions
High schoolers differentiate between a relation and a function. For this algebra lesson, students identify a pair of coordinates as being a relation or a function. They analyze graphs for function as they solve word problems.
Curated OER
Math Journal: Functions and Coordinate Geometry
Fifth graders examine the many uses of coordinate grids. In this graphing lesson, 5th graders write data driven equations, discuss the x and y-axis, and determine if using 2 or 3 ordered pairs is better. Students complete several...
Curated OER
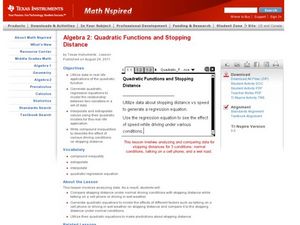
Quadratic Functions and Stopping Distance
Students solve quadratic equations. In this algebra lesson, students factor and graph quadratic functions. they use the properties of quadratics to calculate the distance.
Curated OER
Introduction to Functions
Students explore functions, function rules, and data tables. They explore terms of linear functions. Students use computers to analyze the functions. Students write short sentences to explain data tables and simple algebraic expressions.
Curated OER
Exponential Functions
In this exponential functions worksheet, 9th graders solve and complete 23 various types of problems. First, they simplify each expression. Then, students evaluate the function at different values of x and plot the ordered pairs. in...
Curated OER
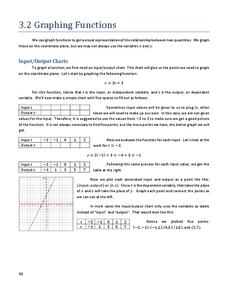
Graphing Functions
In this graphing functions worksheet, students write functions in logarithmic and exponential forms. They evaluate logarithms and determine the inverse of a function. Students graph functions. This six-page worksheet contains 20...
Curated OER
Function of a Stem
Fourth graders perform an experiment to test the function of a stem. In this science lesson, 4th graders write a description of their investigations. Students also explain how the stem interacts with the rest of the plant. Students use...
Curated OER
Exponential Functions
In this algebra instructional activity, students evaluate exponential functions using tables and graphs. There are 6 questions with an answer key.
Curated OER
Data Management and Probability: Applications
In this data management and probability applications worksheet, 8th graders solve 20 various types of probability problems. They find the mean, median, mode and range of various numbers. Then, students use the spinner illustration to...
Curated OER
Veggie Chop and Data Analysis
First graders chop vegetables into fractions. In this fractions instructional activity, 1st graders cut vegetables, collect data about favorite vegetables and create a bar graph using the information. Students make inferences about the...
Curated OER
Piecewise Modeling with Multiple Functions: Federal Debt
Students analyze data on debt and write an equation. In this statistics instructional activity, students are given data from different time periods, and are asked to graph and analyze the data. They work in groups, and are assigned...
Curated OER
Using Data Analysis to Review Linear Functions
Using either data provided or data that has been collected, young mathematicians graph linear functions to best fit their scatterplot. They also analyze their data and make predicitons based on the data. This lesson plan is intended as a...
Curated OER
Three Methods for Using Quadratic Functions to Model Data
In this modeling data learning exercise, students use quadratic functions to model data using three different methods. This learning exercise provides explanations and an example. Additionally, students are given the steps to find the...
Curated OER
ABC Data Sheet Version 2
I have filled out quite a few of these in my day! This ABC (antecedent, behavior, consequence) sheet is intended to collect comprehensible data to help determine the function of a particular behavior. This is a vital tool for assessing...
Curated OER
Student Costs Data Table
Young scholars compare and contrast two routes selected for a virtual field trip. They create a data table of educational activities, lodging, and meal costs using Microsoft Excel software.
Curated OER
The M & M Function
In this M & M learning exercise, learners perform probability experiments. They collect and interpret data, identify the exponential function describing the data and create graphs from the collected information. This one-page...
EngageNY
Graphs of Exponential Functions
What does an exponential pattern look like in real life? After viewing a video of the population growth of bacteria, learners use the real-life scenario to collect data and graph the result. Their conclusion should be a new type of graph...
Council for Economic Education
Employment Data: Is the Economy Healthy?
Low unemployment is an indicator of a healthy economy—right? Current employment data and research leads scholars on a quest to find the true health of the economy. They analyze research on Payroll Employment Data and watch a short video...
Council for Economic Education
Economic Data Lesson: Economic Policy Options
Can you make decisions that will impact millions of people around the nation? Scholars research the role of the Federal Reserve, and its Chairman, on the economic outlook of the country. They analyze current trends in unemployment,...


