Curated OER
Is Temperature Effected By How Close You Are to the Equator
Students collaborate with other schools to gather temperature data from a large number of locations. They determine how the average daily temperature of a location is affected by how close you are to the equator.
Curated OER
The School Holiday Calendar
Various Muslim holidays and their meanings are researched and your students will predict whether or not they should be recognized on the New York City school calendar. An extension could be to write a letter to the Mayor about...
Curated OER
Synthesis of Information
Locating and synthesizing information is an essential part of the research process but can be overwhelming for many young writers. Eliminate some of the stress and confusion, this resource suggests, by separating these steps. To focus...
Curated OER
A New Deal for African Americans
Students consider how New Deal programs impacted African Americans. For this New Deal lesson, students collaborate to research Internet and print sources regarding selected New Deal programs and African Americans....
Curated OER
Tree Identification to Observe Diversity of a Given Nature Area
In this tree identification lesson plan, 2nd graders read A Tree is Growing, discuss what makes up a forest, brainstorm characteristics of leaves, gather samples of leaves and examine their samples. Students will sort leaves and compare...
Curated OER
Plotting with Pennies
Fifth graders use pennies to gather data, organize and order data, graph the data on a stem-and-leaf plot, and evaluate the range, median, and mode of the data.
Curated OER
Put Your Heart Into It
First graders sort Valentine candies according to kind. Data is inserted into a spreadsheet and displayed in various graphic formats.
Curated OER
Diagonal Lengths
Students collect, organize, and analyze data while studying the Pythagorean Theorem, measure length and width of several rectangular objects, and compare the measured results to the calculated results.
Curated OER
Animal Investigation
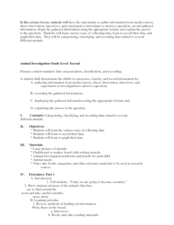
Third graders gather information and classify animals. In this animal investigation lesson plan, 3rd graders research animals, and organize the information into notebook.
Curated OER
Checking County Numbers
Students use their county's information page to gather information about their community. Using the information, they create graphs from the tables provided and interpret the data. They write a paragraph showing their interpretation of...
Curated OER
Dating Practices
Students interpolate, extrapolate, and make predictions from given information. They present results and conclusions from given data using basic statistics. Pupils create a survey from a critical question and decide which sampling...
Curated OER
Carbons to Computers - 3
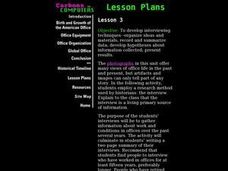
Learners develop interviewing techniques--organize ideas and materials; record and summarize data; develop hypotheses about information collected; present results.
Curated OER
Earth Day Trash Survey Unit
Students develop a questionnaire to distribute via e-mail or Web page forms that visitors fill out based on the data they gathered during their clean-up activities.
Curated OER
A Bird's Eye View of our 50 States
Third graders focus on state birds as they learned absolute location (latitude/longitude) of each state, as well as their relative location (bordering states).
Curated OER
The Demise of Copper's Trading Power
Eighth graders evaluate statistical equations. They examine data from archaeologists at Jamestown, complete statistical equations using the sets of data, and graph the results.
Curated OER
Math: Reaching New Heights
Students apply math skills to assess the range, mean, mode, and median of data sets. Using a "Reaching New Heights" worksheet, they review and discuss how to calculate the answers. Students write complete explanations of all their...
Curated OER
Code Breakers
Learners collect data and make a frequency table, change ratios into percents, and analyze data to make predictions.
Curated OER
Probability Plus
Students participate in a variety of activities to understand statistics. They collect and interpret data. Also students distinguish the difference between a population and a sample. They make inferences and create arguments using data.
Curated OER
Keypals and You
Students collect and compare data received from keypals. They use electronic mail to exchange information with keypals and rrite a paper comparing similarities and differences between themselves and their keypals. In addition, use a...
Curated OER
Mother May I?
Third graders measure distance using nonstandard units of measure. In this measurement lesson, 3rd graders measure a given distance through the use of the game "Mother May I?" Student gather and compare data on how many "giant steps" and...
Curated OER
Fast Food Survey Using Bar Graphs
Second graders conduct survey and sort data according to categories, construct bar graph with intervals of 1, and write a few sentences about their graphs.
Curated OER
A Canadian Inventory: The Way We Are!
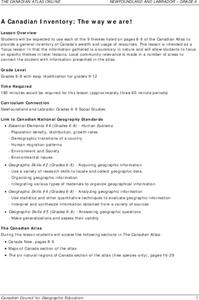
Students use the Canadian Atlas to discover an inventory of Canada's wealth and usage of resources. Using charts and graphs, they produce a wall of selected data of importance to the country and identify one issue of sustainability. ...
Curated OER
Clean Sweep
Learners organize and conduct a cleanup of a local beach, lake, or stream. They keep track of the types and amounts picked up and analyze this information in the classroom.
Curated OER
Cancer Warrior
Students perform an experiment to determine how different salt concentrations affect the liver's ability to break down toxic hydrogen peroxide. They record and average their data which is then graphed.
