Curated OER
Electronic Spreadsheets & Iditarod 2000
Students use the Internet for gathering information for Iditarod race journals. They use a spreadsheet program for entering data and making charts for showing changes in speeds achieved over a period of four weeks in timed writings in...
Missouri Department of Elementary
Keep Finding the Positive
Group members take on roles to create a positive classroom community. Learners perform their role—leader, recorder, presenter, timekeeper, encourager, and collector—in preparation for a formal presentation of their positive thinking...
Curated OER
The Seasonal Round and The Cycle of Life
Fourth graders are introduced to the concept of the seasonal round and how folklife traditions vary from season to season. They begin charting dates of personal interest on seasonal round calendars by starting with birthdays. Students...
Curated OER
Putting Your Best Foot Forward
Third graders measure their feet and their parents' feet, record data on computer-generated graphs, and calculate and record mean, median, and mode.
Curated OER
A Bar of Many Colors
Second graders use colored candies to collect data, construct double bar graphs, and find averages.
Curated OER
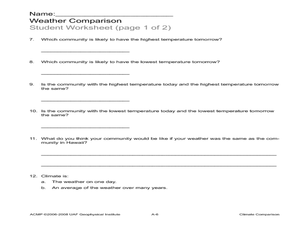
Climate Comparison
Young scholars explore climate regions. In this climate lesson, students examine the climate regions of Alaska as well as the state of Hawaii. Young scholars research selected Internet sources to gather information regarding the climates...
Curated OER
How Effective is Perspiration at Cooling?
Students collect data on the cooling of water in two different test tubes, one that is wrapped in wet newspaper and one in dry newspaper. They then relate this cooling effect to the body's perspiration.
Curated OER
Oil Market Basics
Students explore the global oil market through a web-quest. In this oil market lesson plan, students conduct a web-quest to gather information related to the global oil market then design and make a mural.
Curated OER
Where We Live
Students analyze Canada's population distribution. They access online information to gather demographic information about two Canadian cities. They compare and contrast the quality of life in the two cities and present their findings.
Curated OER
Exploring our Community
Students research Los Angeles and its surrounding communities. They create digital presentations of the information they have gathered by answering the question included in the lesson.
Curated OER
Patriots and Loyalists
Fifth graders take a clear stance on the Revolutionary way by choosing the side of the patriot or loyalist. They compare and contrast the positions of both the loyalists and the patriots using a graphic organizer. Using the information...
Curated OER
Mars: Off the Charts--Until You Put It There
Pupils explore the night sky and make illustrations which are shared in class the next day. Distinctions are made between the stars and the planets and views of the constellations for the season are made available. The work of early...
Curated OER
Dino Hunt
Students use the Internet to gather information about dinosaurs. They practice navagating through the different websites. They also practice listening to directions and also explore how to fill out a KWL chart.
Curated OER
Nutrients
Fourth graders understand the important nutrients in food and the value of each. In this nutrients lesson, 4th graders complete a chart giving examples of foods that contain that nutrient and a definition of the nutrient. Students...
Curated OER
And the Winner Is...
Third graders participate in an election project. They collect data to create a spreadsheet from which a graph is generated.
Curated OER
World-wide Search for the Dominant Trait
Students receive instruction on dominant/recessive traits, access World-Wide Search for the Dominant Trait and download information on which traits to assess. They collect data on at least 20 people and prepare a data chart.
Curated OER
Ratios Through Social Studies
Pupils analyze and integrate mathematical concepts within the context of social studies. They gather, present and analyze information on a bar graph, pie chart, etc. Students compute ratios. They demonstrate that ratios have real-world...
Curated OER
Technology Integration Lesson Plan: Music Database
Eighth graders gather information on fifteen of their favorite songs, create database with fields representing different attributes, explore and sort their databases, and create charts and graphs showing amount of play time vs. popularity.
Curated OER
Color Matters
Young scholars create a spreadsheet to chart favorite colors, then collect data, create appropriate charts, and use percentages to describe quantities.
Curated OER
Cultural Corner- "Mexico"
Students use print and electronic resources to gather information about Mexico. They present a mini-museum to share with students, parents, and other interested classes around the district. They present their information in a video...
Curated OER
Show Me the Money!
Students investigate the importance of campaign finances in elections in the United States by gathering information from various Web sites about campaign finances of different Presidential hopefuls.
Curated OER
What's Your Favorite Stuffed Animal?
Second graders gather information in a survey and interpret the results using a tally chart, a table, and a bar graph. They' present their results of the during the final group discussion. The subject of the survey is favorite stuffed...
Curated OER
Seeking Super Cities
Students view a Powerpoint presentation on various cities in the U.S. They conduct research on two cities, complete a data chart on the two cities, and decide which one they would prefer to live.
Curated OER
Owning a Pet
Fourth graders identify and use different forms of writing for various purposes. Using the internet, they read and gather information and write quesitons for their own investigations on the various pets they could own. They practice...
