Science Education Resource Center at Carleton College
Serc: Lab 3: Discovering Local Data
An investigation that is part of a series of lab lessons that expose students to Earth Systems through research, data, and visulazations. This lab specifically has students using a database to gather and graph data to understand the role...
National Center for Ecological Analysis and Synthesis, University of California Santa Barbara
Kids Do Ecology: Marine Mammal Pages
Learn all about marine mammals at this fun site from the National Center for Ecological Analysis and Synthesis. Explore different species, learn about migration, gather and graph marine data, and more.
TeachEngineering
Teach Engineering: Biomimicry: Echolocation in Robotics
Students use ultrasonic sensors and LEGO MINDSTORMS NXT robots to emulate how bats use echolocation to detect obstacles. They measure the robot's reaction times as it senses objects at two distances and with different sensor threshold...
Discovery Education
Discovery Education: Science Fair Central: Investigation Set Up and Collect Data
A brief overview of how to gather both quantitative and qualitative data, complete with a sample data table.
Rice University
Rice University: Cynthia Lanius: Fun and Sun Rent a Car
A wide range of math skills is incorporated into a lesson that involves planning a family's vacation to Florida. Travel expenses are gathered and compared, graphed, and analyzed in hopes of finding the best prices. There are extension...
Books in the Classroom
Carol Hurst's Children's Literature Site: Data Gathering and Analyzing
Carol Hurst provides this sample chapter from "Picturing Math." Gathering data is a frequent part of solving problems and satisfying curiosity, which includes working with graphs and using mathematical tools such as averaging and other...
TeachEngineering
Teach Engineering: Environment
Through 10 lessons and more than 20 hands-on activities, students are introduced to the concept of an environment and the many interactions within it. As they learn about natural and human-made environments, as well as renewable and...
ClassFlow
Class Flow: Fitting Models to Data
[Free Registration/Login Required] A basic premise of science is that much of the physical world can be described mathematically and many physical phenomena are predictable. This scientific outlook took place in Europe during the late...
University of South Florida
Florida Center for Instructional Tech: Wacky Water World
At this site investigate linear equations with a graphing calculator. Data is gathered from a hypothetical situation of purchasing tickets at a waterpark.
PBS
Pbs Kids Afterschool Adventure!: Operation: All About Us Activity Plan
It's time to stand in the spotlight! During this Afterschool Adventure, children will learn about and practice a variety of math skills as they gather information about their favorite subject-themselves! Children will start out by...
Texas Instruments
Texas Instruments: A Steep Hike Adventure 3
Students use the CBR 2 to gather distance and time data for various walking speeds. They observe the effect of change in direction and speed of motion on distance versus time graphs. Students interpret and analyze graphs, calculate slope...
Other
Delta State University: Lesson Plan 3: Pie Graphs
The students will gather, organize, and display data in an appropriate pie (circle) graph using M&M's! [PDF]
ClassFlow
Class Flow: Survey Questions
[Free Registration/Login Required] Students can answer the survey questions to supplement the Everyday Mathematics program. Students can practice analyzing the data gathered from their friends.
Better Lesson
Better Lesson: Foods Third Graders Like
Third graders gather simple data, represent it on a bar graph, and answer simple, complex, and open-ended questions about the data.
Alabama Learning Exchange
Alex: Heads Up!
The lesson is a hands-on project. Learners will work in pairs to gather various measurements, organizing the data into a provided chart. The measurements will be used to review, reinforce, and introduce skills such as measures of central...
Alabama Learning Exchange
Alex: Comparing Modes of Transportation
In this instructional activity students will visit different websites in order to decide the best mode of transportation from their home town to New York City. Students will use internet links during the instructional activity to gather...
ClassFlow
Class Flow: Dice and Probability
[Free Registration/Login Required] This flipchart is designed to explore the probability of rolling certain values using the dice tool. By the end of this lesson, the students will have gathered experimental data, made hypothesis about...
TeachEngineering
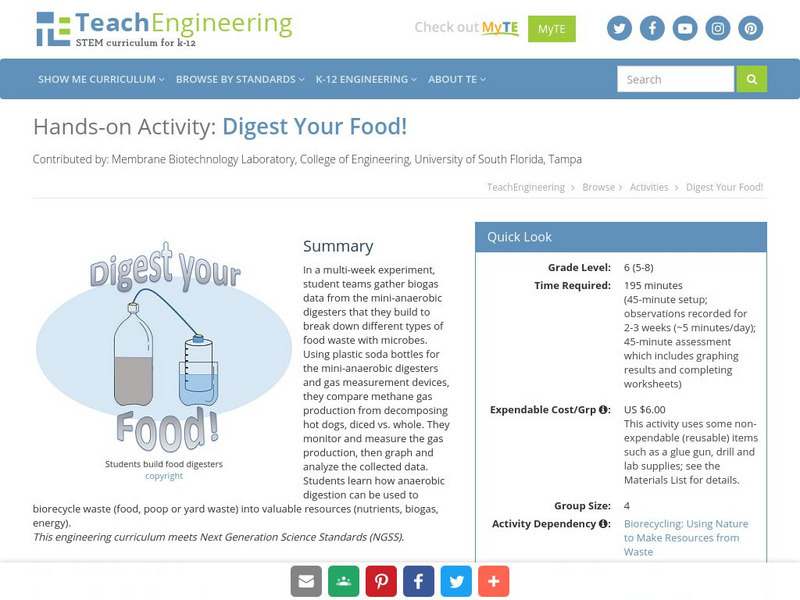
Teach Engineering: Digest Your Food!
In a multi-week experiment, student teams gather biogas data from the mini-anaerobic digesters that they build to break down different types of food waste with microbes. They compare methane gas production from decomposing hot dogs,...
Education Place
Houghton Mifflin: Eduplace: Extra Practice Quiz Mean, Median, Mode, Range 2
Practice using the graph to answer questions about the mean, median, mode and range. Read the interactive quiz rules and then click on the "Begin" ticket. If you answer incorrectly you get one more chance to try again then you are told...
Education Place
Houghton Mifflin: Eduplace: Extra Practice Quiz Mean, Median, Mode, Range 1
Practice using the graph to answer questions about the mean, median, mode and range. Read the interactive quiz rules and then click on the "Begin" ticket. If you answer incorrectly you get one more chance to try again then you are told...
Science Education Resource Center at Carleton College
Serc: Discovering Velocity Outside of the Classroom
A physics lab activity where students gather data from classmates running at different rates on a football field. They then share their gathered data and transfer it to a graphing program to ultimately calculate average velocity.