Curated OER
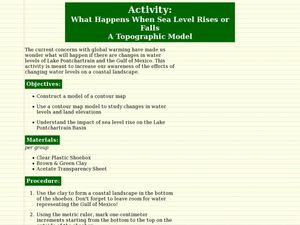
What Happens When Sea Level Rises or Falls
Students examine the impact of sea level on land formations. In this geography and map lesson plan, students construct a contour map model illustrating how much of the clay "coastline" is covered as water is added. Metric measurement...
Curated OER
Explore Surface Types on a Journey Around Earth
Students explore satellite data. In this technology cross-curriculum math and world geography lesson, students locate specific map areas using a microset of satellite data. Students use technology and math skills to determine percentages...
Curated OER
Contour and Cross-Section Skills
In this geography worksheet, learners identify the Wolf Creek Crater and how it was formed. They examine a contour map given of how the crater would look from above. Then, pupils use a ruler to draw lines as on the graph to the side....
Curated OER
Puzzling Clue Vocabulary
Students play a matching, puzzle-like game designed to help them review and practice a given subject matter.
Curated OER
Canada's Climate: Temperature and Rainfall Variations
Students analyze data about various climates in Canada. In this data analysis and climate lesson, students use Canada Year Book 1999 to complete a worksheet and make connections between precipitation and temperature in different climates.
Curated OER
The Ie Storm 1998: Maps and facts activity
Students investigate the St. Lawrence River Valley, ice Storm of 1998. In this middle school mathematics lesson plan, students interpret ice storm data from tables and maps. Students write about their own experiences of the ice storm.


