University of Oregon
University of Oregon: Global Climate Animations
Check out this site for global climate animations. "Get a feel for why we have seasonal weather changes or why other regions have different weather than you do."
NASA
Nasa: Climate Time Machine
Travel through time and explore how the changing climate has affected sea ice, sea level, carbon dioxide levels, and global temperatures. Also, decide whether or not you would be affected if the sea level rose due to warmer temperatures...
BBC
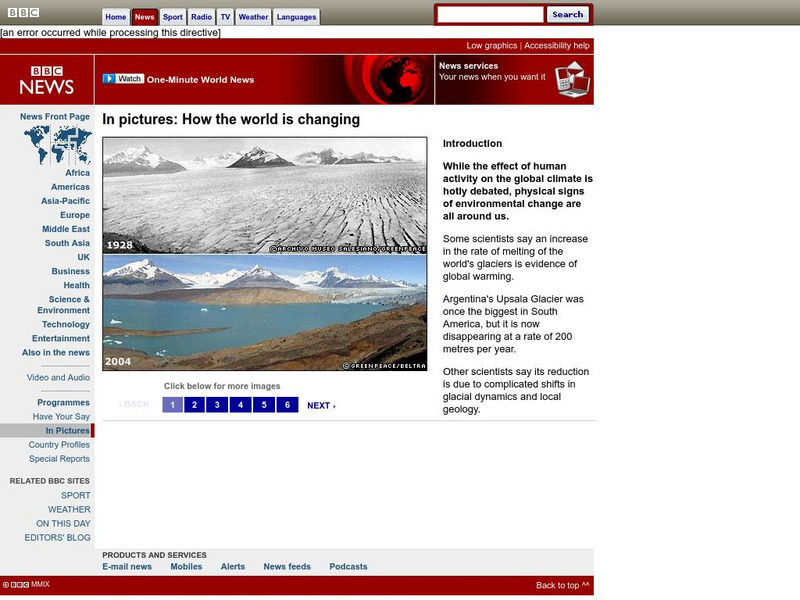
Bbc News: In Pictures: How the World Is Changing
View and read about climate change by comparing two images of the same location at different times.
BBC
Bbc News: An Animated Journey Through the Earth's Climate History
A narrated journey through the last 800,000 years of the Earth's climate, accompanied by images and graphs. A text-only version is also available. (Published 3 Dec. 2009)
NASA
Nasa: Climate Time Machine
Take a trip in a "time machine" to see a series of pictures that show the how the climate of Earth has been changing. The indicators shown are: sea ice, sea level, carbon dioxide, and global temperature.
PBS
Pbs Learning Media: Global Warming: Graphs Tell the Story
Examine these graphs from the NOVA/ FRONTLINE Web site to see dramatic increases in the temperature of Earth's surface and greenhouse gases in the atmosphere.
University Corporation for Atmospheric Research
Ucar: The Very, Very Simple Climate Model
Through a simple online model, students learn about the relationship between average global temperature and carbon dioxide emissions while predicting temperature change over the 21st Century.
National Center for Ecological Analysis and Synthesis, University of California Santa Barbara
University of California: A Global Map of Human Impacts to Marine Ecosystems
Maps in different categories such as fishing, climate change, and pollution were pulled together into a composite map that shows the impact of humans on the world's oceans. Analysis at the time (2008) showed that 40% of the world's...
NASA
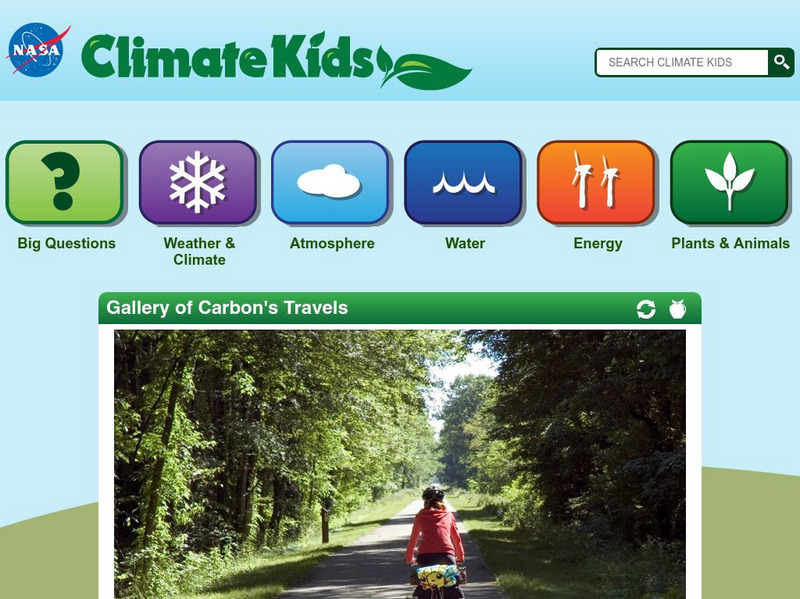
Nasa: Climate Kids: Gallery of Carbon's Travels
A collection of images which shows the effects of too much carbon in our atmosphere There are also some promising carbon-reducing images as well.
University Corporation for Atmospheric Research
Ucar: Why Earth Is Warming
Over more than a century, the global average temperature warmed 1.5F (0.8C). Learn the science of why this has happened, and what the future holds.
PBS
Pbs Learning Media: Arctic Ice Reaches 2015 Minimum Extent
NASA's Scientific Visualization Studio uses data from several sources to track seasonal changes in Arctic sea ice and land cover over time. Scientists study sea ice because it influences global climate. Watch the following visualization...
PBS
Pbs Learning Media: Arctic Ice Extent, 1999 2016
Scientists study sea ice extent closely because it influences global climate. Follow the decline in Arctic sea ice in this animation adapted from NASA showing the yearly maximum and minimum sea ice extents from 1999 to 2016. Resources...
Curated OER
Bbc News: In Pictures: How the World Is Changing
View and read about climate change by comparing two images of the same location at different times.
US Geological Survey
U.s. Geological Survey: Repeat Photography Project
The Repeat Photography Project pairs historic images with contemporary photos thus documenting glacial decline through photography while communicating the effects of global warming.
PBS
Pbs Learning Media: Greenland Mass Variation Since 2002
Scientists study ice sheets because they influence weather and climate, playing a role in atmospheric and ocean circulation. Ice sheets can also have huge impacts on global sea levels because they store so much water. Explore this...
PBS
Pbs Learning Media: Link Between Arctic Sea Ice and Solar Radiation Absorbed
The Arctic plays an important role in regulating Earth's climate. The region reflects much of the Sun's energy and helps keep the planet cool. Data collected by NASA have revealed that sea ice in the Arctic has steadily declined over the...
Other
Gfdl: Temperature (F) Response Due to Increased Atmospheric Co2
An animated model of the Earth from the Geophysical Fluid Dynamics Laboratory showing how global temperatures increased from 1870 to 2100 due to rising amounts of carbon dioxide in the atmosphere.
PBS
Pbs Learning Media: What's Up With the Weather: Graphs
Examine this graph from FRONTLINE/NOVA: "What's Up with the Weather?" Web site to see dramatic increases in three greenhouse gases over the last two hundred years.
Other
Vox Media: Weather 2050
See what the average winter and summer temperature is predicted to be in your town in 2050.
University Corporation for Atmospheric Research
Ucar: The Water Cycle
Water can be in the atmosphere, on the land, in the ocean, and underground. It moves from place to place through the water cycle.
Other
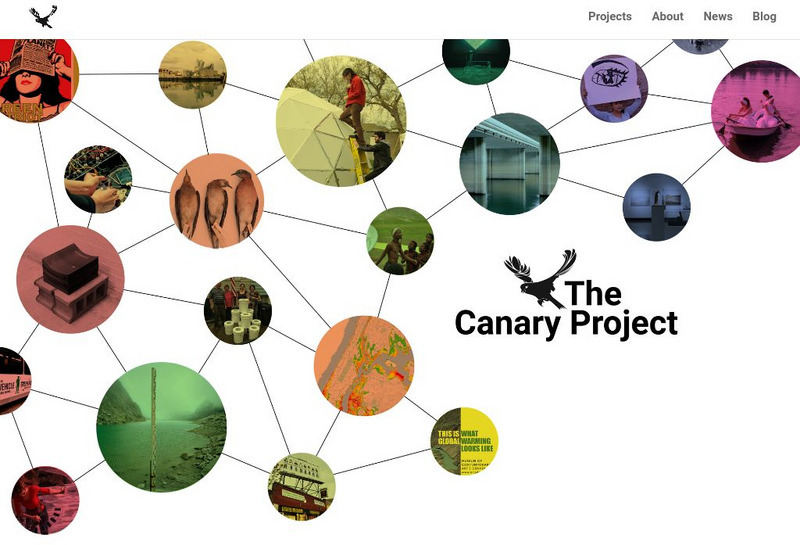
The Canary Project
If you're looking for photographic evidence of global warming, then this is a good resource to check out. Photographs from around the world document the effects of global warming.
NPR: National Public Radio
Npr: Greenland: Ice on the Move
NPR offers a photographic slide show on the status of Greenland's ice glaciers as they start to melt and the consequences of the melting for the future.
Curated OER
Capitol Steel Mill
China has a population of over one billion people and is a huge energy consumer. No examination of global warming would be complete without looking at China's contribution to the problem, its burgeoning awareness of this and its efforts...
Curated OER
Beijing's Center
China has a population of over one billion people and is a huge energy consumer. No examination of global warming would be complete without looking at China's contribution to the problem, its burgeoning awareness of this and its efforts...
Other popular searches
- Global Climate Change Arctic
- Global Climate Change Ice
- Global Climate Change Asia
- Global Climate Change Debate
- Global Climate Change Impact


