Other
Object of History: Chinese Miners (Chinese Immigration During the Gold Rush)
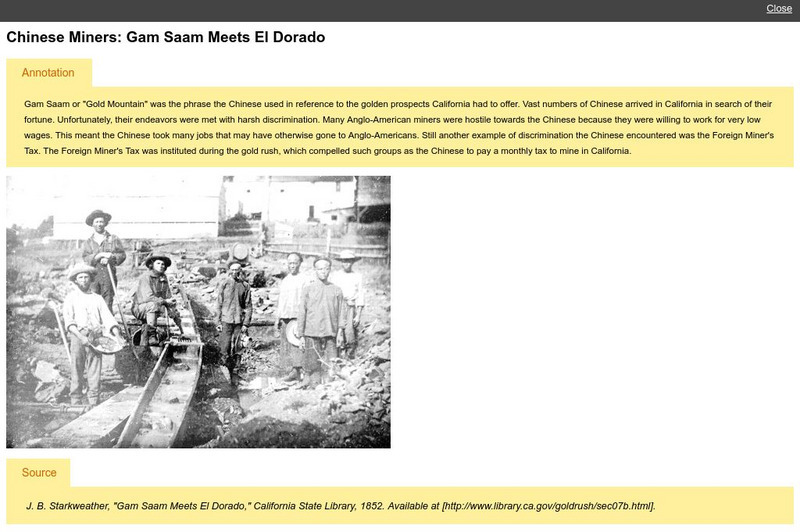
An image is provided of "Gan Saam Meets El Dorado," which depicts the Chinese miners in California during the 1850s in search of gold.
Curated OER
Object of History: Chinese Miners (Chinese Immigration During the Gold Rush)
An image is provided of "Gan Saam Meets El Dorado," which depicts the Chinese miners in California during the 1850s in search of gold.
Curated OER
Wikipedia: National Historic Landmarks in California: Coloma
Town where the California Gold Rush when James W. Marshall discovered gold at Sutter's mill on January 24, 1848. Now a ghost town, it is a significant part of the Marshall Gold Discovery State Historic Park.
Curated OER
Wikipedia: National Historic Landmarks in California: Columbia Historic District
Within two years of discovering gold in this town, it was the 3rd largest city in California. The historic district is now an open museum and the best preserved California Gold Rush town.
Curated OER
Wikipedia: National Historic Landmarks in California: Sutter's Fort
A 19th century agricultural and trade colony, it was known for its connection to the Donner Party, the California Gold Rush, and the formation of Sacramento as well as its proximity to the California Trail and Siskiyou Trails. Now a...
Curated OER
Wikipedia: National Historic Landmarks in California: Old United States Mint
Built for the San Francisco Mint in 1874 to handle the overflow from the California Gold Rush, this building is affectionately as The Granite Lady. It is one of the few that survivors of the great 1906 San Francisco earthquake and served...
Curated OER
Wikipedia: National Historic Landmarks in California: Bodie Historic District
Establish in 1859, it became a Gold Rush boomtown in 1876. It is currently a State park preserved in arrested decay, neither restored nor destroyed. It is one of very few towns of this type to survive untouched.
Curated OER
Chinese Laborers Build Central Pacific Railroad Trestle in the Sierra
Published in 1924, the book, "The Story of California from the Earliest Days to the Present," by Henry K. Norton, relates the lives of the Chinese who immigrated to California to participate in the gold rush. He also recounts the...
Curated OER
Wikipedia: Natl Historic Landmarks in Ca: Old Sacramento Historic District
Built up after the California Gold Rush, this historic district also includes the NHL locations of the Pony Express Terminal and the Big Four House.
Curated OER
Virtual Museum of San Francisco Ulysses S. Grant and the Gold Rush
From Ulysses S. Grant's memoirs is this description of his 1852 trip to California across Panama and his stay in San Francisco.
Curated OER
Hydraulic Mining
Provides pictures and information about hydraulic mining (using jets of water to break down gold-laden gravel banks) for gold.
Curated OER
Hydraulic mining.jpg, 0 Bytes
Provides pictures and information about hydraulic mining (using jets of water to break down gold-laden gravel banks) for gold.
Curated OER
Hart Stereoview #61, Hydraulic Mining
Provides pictures and information about hydraulic mining (using jets of water to break down gold-laden gravel banks) for gold.
Curated OER
Cover Art
Carol Hurst uses one of her own books, "In Plain Sight," as a basis for this lesson plan on the California gold rush. In addition to discussion questions about the book, Hurst provides ten activities designed to help students explore...
Curated OER
Etc: Maps Etc: Distribution of Population , 1850
A map of the United States showing the population distribution in 1850. The map is coded to show population densities ranging from under 2 inhabitants per square mile to over 90 inhabitants per square mile. The map illustrates the...

