Curated OER
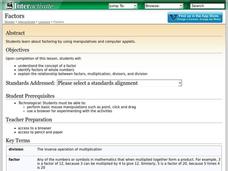
Factors
Practice factoring numbers by using graph paper, manipulatives and computer applets.
Curated OER
Leaf Weight-Loss Plan
Students measure the weight of a container of leaves daily to discover how quickly it grows lighter as the foliage dries.
Curated OER
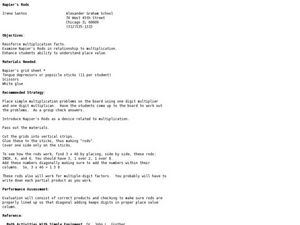
Napier's Rods
Young mathematicians explore the concept of multiplication using Napier's Rods. They use Popsicle sticks to create a 3D model of Napier's Rods. Pupils multiply multiple digit numbers using Napier's Rods.
Curated OER
Great Shapes Alive!
Compare two- and three-dimensional shapes and construct three dimensional models from two-dimensional shapes. Diagram the shapes and reflect about the process in writing.
Curated OER
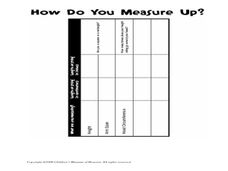
How Do You Measure Up?
Students measure their body. In this measurement lesson plan, students use a string to measure their height and the circumference of their head. They record this information on the worksheet provided and answer questions as a group.
Curated OER
Children's Museum of Houston - Pre/Post Classroom Activities - Nets
Students make three dimensional shapes with nets. In this nets lesson plan, students receive nets which they fold to make a three dimensional object. They predict what shape each net will make and verify it after making the net. They use...
Curated OER
All in the Family
Students use data to make a tally chart and a line plot. They find the maximum, minimum, range, median, and mode of the data. Following the video portion of the lesson, students will visit a Web site to test their data collection skills...
Curated OER
Introduce Double-Digit Addition
Young scholars generate a list of numbers then classify them into groups of single digit and double-digit numbers. After listening to a children's book about double-digit addition, they work with tens and ones blocks to solve...
Curated OER
How Alike Are We?
Fourth graders find the range, mode, median, and mean for each of the data sets (height and shoe size). They discuss which measure of central tendency for each data set best represents the class and why. Students graph the shoe size and...
Curated OER
Take a Chance
Students explore possible outcomes and impossible events. They determine if an event is likely or unlikely. Students investigate the possible outcomes of events and they record the outcomes. Students discuss their answers and use...
Curated OER
Guess My Piece -working with Legos
Students participate in guessing their partners' hidden Lego pieces from their verbal clues. They work in partners to accomplish their goals. They are meeting a variety of math standards by completing this instructional activity.
Curated OER
Spinning Nickels
Pupils make predictions to figure out the probability of a spun nickel landing on either heads or tails. They test their predictions through experimentation. They create a graph showing the frequency for the number of heads.
Curated OER
Cold Enough?
Students read and record temperatures and display the data. They represent the temperatures on an appropriate graph and explain completely what was done and why it was done. Students display the data showing differences in the daily...
Curated OER
Tally Charts and Graphs
Fourth graders play the game 'Data Picking', where they collect data, place the data into a tally chart, and choose the circle graph that best represents the data. They go to the Mathfrog website and select 'Picking'. Students choose...
Curated OER
Using Arrays to Show Multiplication Concepts
Students draw arrays. In this multiplication lesson, students draw arrays, write multiplication sentences for arrays and discuss how changing the order of the factors affects the product.
Curated OER
Adjusting the Quotient
Fourth graders use number facts to estimate quotients. In this division lesson, 4th graders examine long division problems to determine which multiple of ten will help them determine a number that is close to a quotient. They adjust the...
Curated OER
Tall Tale Rollers
Students explore American tall tales. In this tall tale lesson, students discover the six characteristics that are included in tall tales. Students survey their class to find each student's favorite tall tale character and organize the...
Alabama Learning Exchange
Poppin' For Popcorn!
Students graph data from different popcorn flavors. For this graphing lesson, students make graphs using an assigned web site after collecting data about the flavors of popcorn that fellow classmates prefer.
Curated OER
A Plane Old Time
Fourth graders become familiar with a chart and use the information to create a flight plan. In this flight plan lesson, 4th graders access background knowledge of the role of flight controllers and the number concepts they...
Curated OER
Plum Stone Dice Game
Young scholars read about a Native American dice game online. They make replica games, and practice playing with them. They predict the outcome of the dice rolls by completing a dice throw chart.
Curated OER
What Did It Cost 100 Years Ago?
Students compare prices of good across the century in order to introduce the topic of inflation. They undertand the concepts of inflation and Consumer Price Index (CPI), use online calculators to figure the approximate cost of goods...
Curated OER
Line 'Em Up!
Young scholars find coordinate points on a grid and create a line graph with those points. This lesson should ideally be used during a unit on various types of graphs. They make and use coordinate systems to specify locations and to...
Curated OER
How Machines Help Us Stay Healthy
Students visit different departments at a local hospital to see how machines help peoples such as the CAT scan machine. They build a model of such a machine that shows how patients are moved in and out of the machine.
Other popular searches
- Fun Math Probability Games
- Probability/math Literature
- Smart Board Math Probability
- Grade 1 Math Probability
- Math Probability Vocabulary
- Math Probability Worksheets
- Sport Math Probability
- Math Probability Factorial
- Math Probability Games
- Grade 4 Math Probability
- Math Probability Lessons
- Probability and Sports Math
