Concord Consortium
Concord Consortium: Linear Equations: Points, Intercepts, and Slopes, Oh My!
Learn how to graph lines with two methods: using x- and y-intercepts and using point-slope form.
Interactive Mathematics
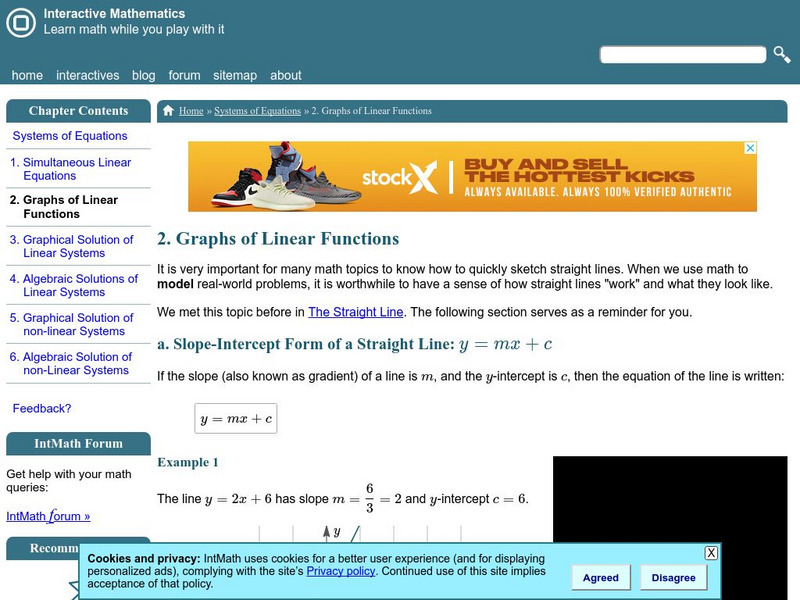
Interactive Mathematics: Graphs of Linear Functions
A brief overview of three methods used to graph lines is presented through examples. Slope-intercept, point-slope, and intercept form are demonstrated step-by-step along with a review of the formula for finding the slope of a line.
Purple Math
Purplemath: Graphing Overview: Straight Lines
This resource provides an overview of graphing for various types of functions, instruction on graphing straight lines and also, includes advice on common mistakes made by students.
Khan Academy
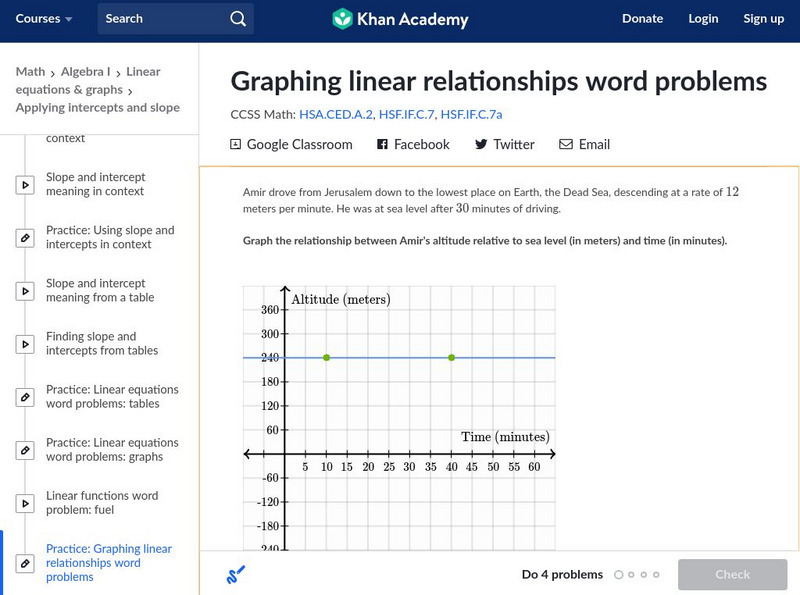
Khan Academy: Graphing Linear Functions Word Problems
Graph the line that represents a real-world relationship that is given verbally. Students receive immediate feedback and have the opportunity to try questions repeatedly, watch a video, or receive hints.
Concord Consortium
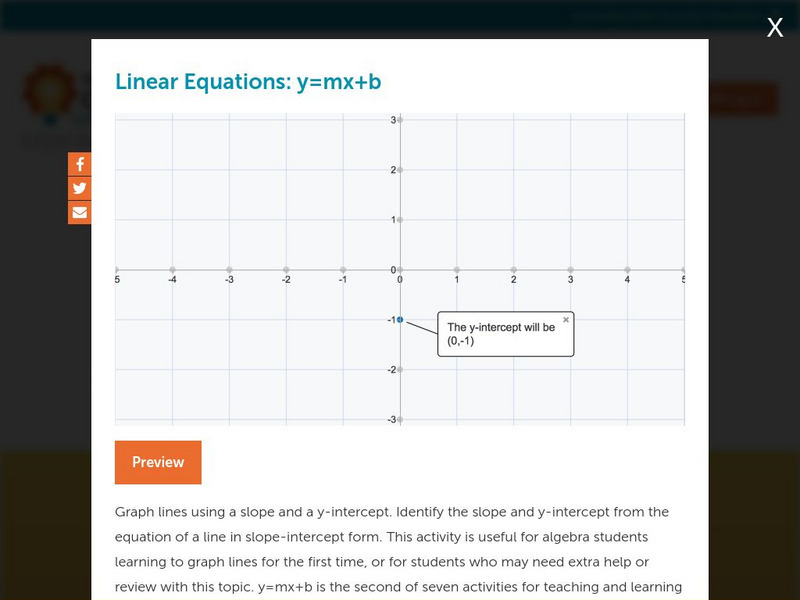
Concord Consortium: Linear Equations: Y=mx+b
Graph lines using a slope and a y-intercept. Identify the slope and y-intercept from the equation of a line in slope-intercept form.
TeachEngineering
Teach Engineering: Forces and Graphing
This activity can be used to explore forces acting on an object, to practice graphing experimental data, and/or to introduce the algebra concepts of slope and intercept of a line. A wooden 2x4 beam is set on top of two scales. Students...
OpenStax
Open Stax: Graphical Analysis of One Dimensional Motion
In the following interactive module students will describe a straight-line graph in terms of its slope and y-intercept. They will determine average velocity or instantaneous velocity from a graph of position vs. time.


