Curated OER
Variables, Formulas, Functions, Graphs
In this function worksheet, students are given 6 short-answer problems regarding formulas vs. functions, graphing functions and different ways to view functions.
Curated OER
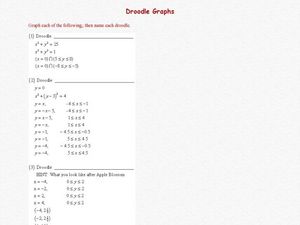
Droodle Graphs
For this algebra worksheet, students graph piecewise functions, and circles using restrictions. They graph a line and chop it on both ends to create a stair case looking graph or a ladder. There are 3 involve questions with an answer key.
Curated OER
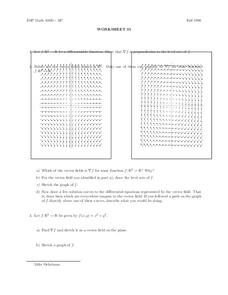
Worksheet 35
In this math worksheet, students analyze two vector fields. They tell which of the vector fields is the scaler field for the given function. Students draw solution curves to match the differential equations represented in the illustrations.
Curated OER
Using Averages to Create Graphs Through Excel
Sixth graders create and use a spreadsheet to make graphs which will be used to analyze Progress Report and Final Report Card grades. They practice finding the mean, median, mode, and range of a data set. Students also incorporate column...
Curated OER
Graphs and Ellipses
Pupils explore linear graphs, the parabola and the rectangular hyperbola.
Curated OER
Absolute Value of Linear Functions
Students identify and interpret how absolute value affects linear functions. They also graph linear functions and reflect them in a line of symmetry. Finally, students evaluate the absolute value of a constant using technology to...
Curated OER
Absolute Value of Linear Functions
Students discover how abolute value affects linear functions. They complete a worksheet simulating a path for miniature golf hole in one for three figures. They construct a hole in one graph for each hole marking the X and Y coordinates.
Curated OER
Interpreting and Displaying Sets of Data
Students explore the concept of interpreting data. In this interpreting data instructional activity, students make a line plot of themselves according to the number of cubes they can hold in their hand. Students create their own data to...
Curated OER
Linear Inequalities in One and Two Variables: Rays and Half Planes
Define rays and half planes, including the concepts of boundary lines and prerequisite knowledge of coordinate planes. Given linear inequalities in one and two variables, your class will compare the differences. They will also graph...
Curated OER
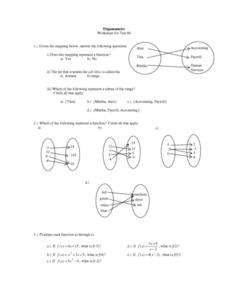
Trigonometry: Worksheet for Test #4
In this trigonometry worksheet, students determine whether given mappings are functions. They evaluate 5 functions for a given x value. Students graph 2 functions. They determine which ordered pairs are solutions to given functions....
Curated OER
Is there Treasure in Trash?
More people, more garbage! Young environmentalists graph population growth against the amount of garbage generated per year and find a linear model that best fits the data. This is an older resource that could benefit from more recent...
Curated OER
Christmas Presents
Seventh graders create a graph of their Christmas gifts. They develop categories, compute fractional and decimal parts for each category, identify the number of degrees to represent each fractional part, and create a circle graph to...
Curated OER
Ellipse
Students find the center, vertices, foci, and eccentricity of ellipses using the subscriptions website www.explorelearning.com. They graph elliptical functions and solve application problems involving ellipses.
Curated OER
Exploring the Witch of Agnesi
students construct the graph of the Witch of Agnesi, and investigate both its asymptotes and inflection points. They construct the graph of the Witch of Agnesi and conjecture the asymptotes and inflection points of the function. ...
Curated OER
Worksheet 22-Fall 1995
In this math learning exercise, students examine the graph of the derivative. Then they determine the critical points that correspond to the relative extrema.
Curated OER
Algebra 2 Test
In this algebra learning exercise, students solve problems involving functions, systems and conics. They simplify radicals and graph parabolas identifying the focus and ellipse. There are 20 questions.
Curated OER
Properties of Definite Integrals
In this definite integral worksheet, learners evaluate the properties of definite integrals. Students graph their answers. This two-page worksheet contains two multi-step problems.
Curated OER
Right Triangles and The Unit Circle
Young scholars solve right triangles using trigonometry. In this geometry lesson, students use the unit circle to identify different trig values. They identify the six trigonometric identities.
Curated OER
Conics and Graphing
In this algebra worksheet, students solve equations by graphing an ellipse, circle and hyperbola. They match equations to graphs and define each type of function. There are 20 questions total.
Curated OER
The Unit Circle
Students relate the trigonometric functions to the coordinates of the unit circle. They classify trigonometric functions as odd or even. Students determine the signs of trigonometric functions in each quadrant. They are explained that...
Curated OER
Woody Sine
Students explore the concept of sine. In this sine lesson, students create a sine graph from tooth picks. Students create a unit circle with tooth pick length radius. Students then take the tooth picks from the unit circle and put them...
Curated OER
Ellipses (Part 1)
Students work with Ellipses in Algebra II. In this algebra instructional activity, students solve an equation with a radical expression. They graph ellipses and write an equation for them.
Curated OER
Meet The Graphs
Students identify two types of graphs. They analyze and interpret authentic data shown in bar and pie graphs and complete a graph given specific data. Perform simple functions within an Excel document:
Curated OER
Approximation of Pi
High schoolers explore the concept of Pi. In this Pi lesson, students measure the circumference and diameter of a circle. High schoolers record the diameter and circumference measurements from their classmates. Students...

