Curated OER
Graphing Systems at the Races
Learners investigate systems of equations as they use the Ti-Navigator to explore scenarios about dog races and NASCAR races. Pupils determine the winner of the race and when opponents pass each other given a speed and distance.
Curated OER
Speed, Distance and Time
In these calculating speed, distance, and time worksheets, 6th graders review information, formulas, and examples, and solve word problems calculating average speeds, distance traveled, time taken, convert time measurements and speeds,...
Curated OER
Acceleration and Average Speed
In this acceleration and average speed worksheet, students learn the equations for acceleration and average speed. They match 6 variables with their quantities, they identify speed vs. velocity and scalar vs. vector and they solve 4...
Curated OER
Graphing of Time and Distance
In this graphing time and distance worksheet, students graph data of a two race cars as they drive over time. Students plot the time vs. the distance for both cars and answer questions about the data. They determine the speed of the cars...
Curated OER
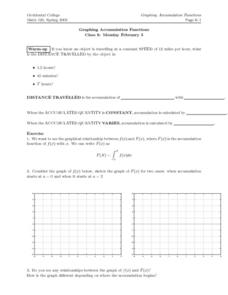
Graphing Accumulation Functions
In this accumulation function worksheet, students find the graphical relationship between two functions. They describe the relationships between the graphs of a function when accumulation begins at 0 and at 2.
Curated OER
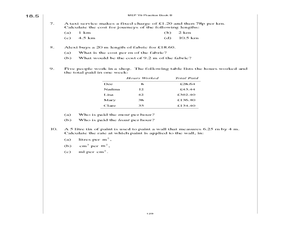
Speed II Problems
In this higher-level math worksheet, students complete 10 problems involving speed, distance, time, and length using graphs and pictures. An excellent worksheet with easy-to-understand graphics and problems.
Balanced Assessment
Ford and Ferrari
Which is faster, a Ford or a Ferrari? The short assessment has pupils analyze graphs to determine the rates of change between the two. Individuals interpret the rates of change within the context of speeds of the cars and develop a map...
Mathematics Assessment Project
Bike Ride
As a middle school assessment task, learners interpret the graph of distance versus time for a bike ride. Pupils then determine distance of the trip, length of the trip, and speeds.
EngageNY
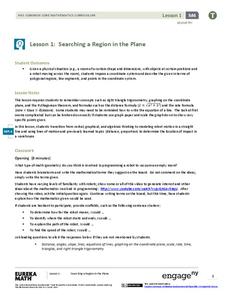
Searching a Region in the Plane
Programming a robot is a mathematical task! The activity asks learners to examine the process of programming a robot to vacuum a room. They use a coordinate plane to model the room, write equations to represent movement, determine the...
Concord Consortium
Cheetah's Lunch
Run like a cheetah. A performance task challenges pupils to solve several different problems involving the speed of a cheetah. Given information for scenarios where the cheetah chases its prey, they determine if the big cat is fast enough.
Bowels Physics
Methods of Motion
How could you earn a $6,000,000 speeding ticket? This presentation uses an analogy that relates speed in the universe to the cost of a speeding ticket. Scholars ultimately understand that motion is relative. Also covered is the concept...
Concord Consortium
Functions by the Slice
Piece by piece ... dismantling a function can highlight interesting patterns. The task asks learners to slice functions in sections with the same vertical change. They then recreate the graph with these slices positioned horizontally....
Curated OER
Speed and Distance
In this speed worksheet, students create time vs. distance graphs to answer questions about average speed, average velocity, and acceleration. This worksheet has 3 problems to solve.
Curated OER
Motion Graphs
In this motion graphs worksheet, learners learn about how motion of objects can be described using a graph. Students then answer 10 fill in the blank, 10 short answer, and 5 problems to solve.
Curated OER
Line Graph: To Grandmother's House We Go
In this line graph worksheet, students use a line graph showing distance traveled to answer a set of 4 related questions. Answers are included on page 2.
Curated OER
Calculating Speed
Fourth graders complete an experiment on calculating speed. In this speed calculation lesson students complete an activity in which they have dominoes fall as slow as possible.
Curated OER
Speed and Experiments
In this speed formula and scientific method learning exercise, students read over descriptions of the formula an method. Students then respond to 12 matching, problem solving and short answer questions.
Curated OER
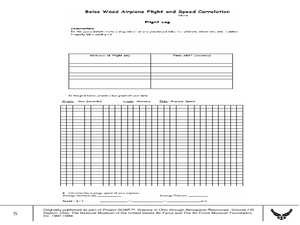
Balsa Wood Airplane Flight and Speed Correlation
Ninth graders calculate the average speed of their balsa wood airplane. In this physics lesson, 9th graders build their own airplane and make necessary modifications to to make it fly straight. They interpret distance and time graph...
Curated OER
Olympic Line Graphs
Sixth graders examine how to make line graphs. In this Olympic line graph lesson students make line graphs and search the given Internet sites to find data on their summer Olympic Game.
Curated OER
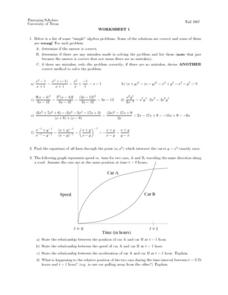
Worksheet 1 - Equation of a Line
In this equation of a line worksheet, students determine the equation of a line, use the distance formula to identify the relationship between two moving objects, and solve inequalities algebraically. This two-page worksheet contains...
Radford University
Midsummer Classic’s Homerun Derby
Hit a home run with your lessons. A two-part activity has learners explore quadratic equations that model the path of a baseball. They see how changing the initial speed of the ball affects its maximum height, maximum horizontal...
Curated OER
Motion of a Bowling Ball
Students experiment with distance, speed, and motion by graphing the motion of a bowling ball. In this distance versus time graphing lesson, students observe the speed and distance of a rolling ball and graph their findings. They then...
Mathalicious
The Fall of Javert
Falling off a bridge might not sound like your idea of a good math problem, but incorporating the final scene of Les Misérables is sure to spark interest. The goal is to use the time Javert fell off the bridge to determine how high he...
Curated OER
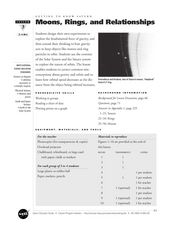
Getting to Know Saturn: Moons, Rings, and Relationships
Students identify the different objects that orbit Saturn. In this space science lesson, students plot the graph of orbital speed and distance. They explain why planets and asteroids remain in orbit around the sun.


