CK-12 Foundation
Ck 12: Algebra: Quadratic Functions and Their Graphs
[Free Registration/Login may be required to access all resource tools.] Graph and compare graphs of quadratic functions in the coordinate plane.
National Council of Teachers of Mathematics
The Math Forum: Ask Dr. Math: Graphing Parabolas
Dr. Math helps a student with the plotting and with finding the vertex and line of symmetry of a parabola.
Texas Instruments
Texas Instruments: Given a Graph, What Is the Function?
Understanding how to associate a function of a parabola with its graph. Students will explore varies functions and determine its graph. They will then use what they learned to predicate where a particular graph of a different function...
National Council of Teachers of Mathematics
The Math Forum: Ask Dr. Math: Parabola Equation
Dr. Math, in a reply to a student's question, describes how to obtain the equation of a parabola.
Paul Dawkins
Paul's Online Notes: Algebra: Common Graphs
Students investigate how to graph a wide variety of equations and functions. Topics explored are lines, rational functions, parabolas, ellipses, and transformations. Class notes, definitions, and examples with detailed solutions are...
Texas Instruments
Texas Instruments: Investigating the Parabola in Vertex Form (Y = Ax2
In this activity, students investigate the standard form of the quadratic function, y = ax^2 + bx + c. They investigate the changes on the graph of a quadratic equation that result from changes in A, B, and C. They also locate the vertex...
Oswego City School District
Regents Exam Prep Center: Parabolas
Students will learn about parabolas and how to graph them. Use the given lesson plan and examples to help support instruction and solve the practice problems.
Cool Math
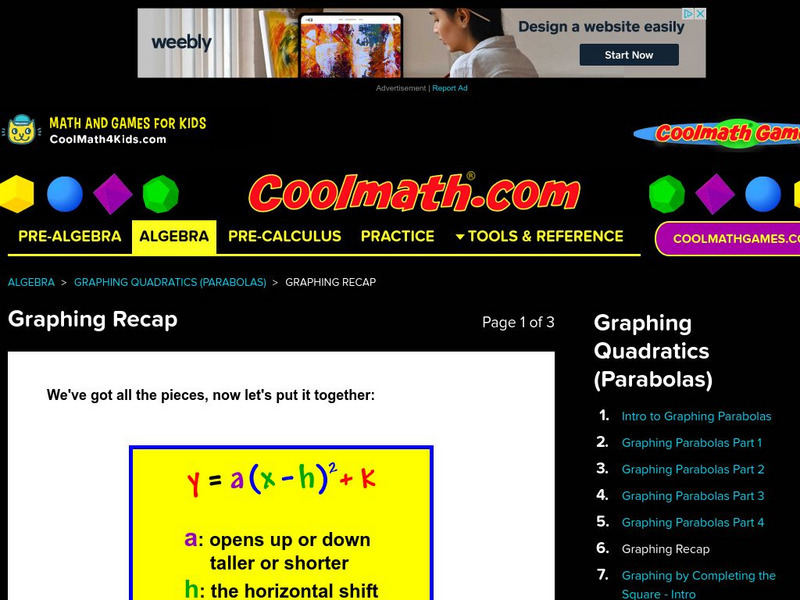
Coolmath: Graphing by Completing the Square Intro
This algebra lesson introduces how to complete the square in a parabola.
CK-12 Foundation
Ck 12: Algebra: Graphs of Quadratic Functions in Intercept Form
[Free Registration/Login may be required to access all resource tools.] Understanding the graphs of a parabola given equations. Students examine guided notes, review guided practice, watch instructional videos and attempt practice problems.
Texas Instruments
Texas Instruments: Parabolas: Numb3 Rs: Structural Corruption
Based off of the hit television show NUMB3RS, this lesson helps students understand how changing the values of y=a(x-b)^2+c changes the graph of the associated parabola. This is framed in the context of a bridge jumper, who enters the...
CK-12 Foundation
Ck 12: Algebra: Quadratic Functions and Their Graphs
[Free Registration/Login may be required to access all resource tools.] Learn the anatomy of the graph of a quadratic function.
Concord Consortium
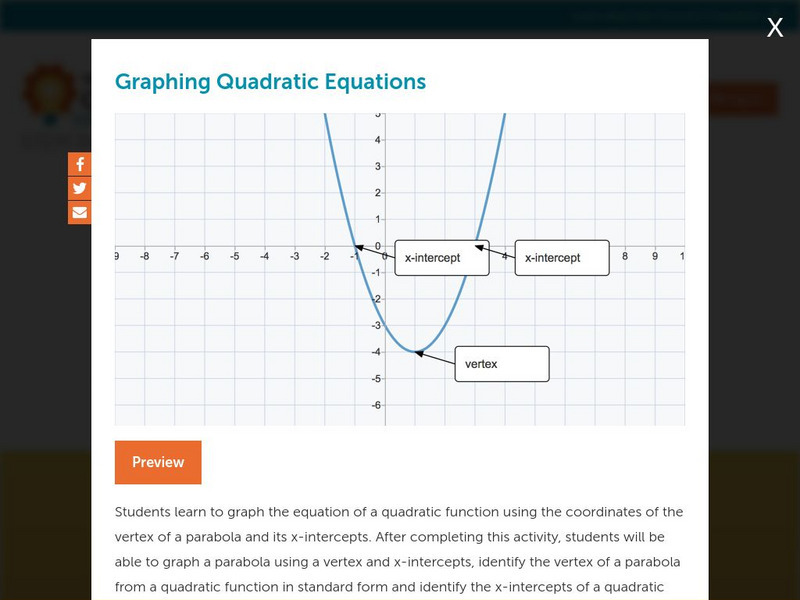
Concord Consortium: Graphing Quadratic Equations
Students learn to graph the equation of a quadratic function using the coordinates of the vertex of a parabola and its x-intercepts.
Purple Math
Purplemath: Completing the Square: Finding the Vertex
Demonstrates step-by-step how to complete the square to find the vertex of a parabola. Thorough descriptions of each problem.
Texas Education Agency
Texas Gateway: Analyzing Graphs of Quadratic Functions
Given the graph of a situation represented by a quadratic function, the student will analyze the graph and draw conclusions.
Texas Instruments
Texas Instruments: Transforming Parabolas
1. Students will be able to review how to find the vertex of a parabola using a graphing calculator. 2. Students will be able to observe the relationship between the values of a, h and k and the graph of a parabola in vertex form. 3....
Purple Math
Purplemath: Conics: Parabolas: Introduction
This reference material introduces the terms and equations related to parabolas in the context of conics. Also, relates concepts to previously-learned material and shows how to 'read' from the 'conics' form of the parabola equation.
Oswego City School District
Regents Exam Prep Center: Graphing Parabolas
Works through an example to show how to graph a parabola. Also shows what a positive and negative axis of symmetry looks like.
Texas Instruments
Texas Instruments: Exploring Standard Form of a Quadratic Function
Students explore y=ax^2+bx+c using the transform graphing application. Teacher calculator is used with Navigator to send device settings, the equation format and initial coefficient values to all students. Worksheet includes all student...
Other
Georgia Perimeter College: Parabolas
This resource provides an examination of parabolas, both vertical and horizontal, and parabolic functions. It includes six examples and a chart showing how changes in the equation coincide with changes in the graph.
Texas Instruments
Texas Instruments: Writing Equations of Parabolas in Vertex Form
Students use their knowledge of the vertex form of a quadratic equation to graph parabolas, given a specific move to make.
Texas Instruments
Texas Instruments: Graphs of Quadratic Functions in Vertex Form
TI Explorations books has a great activity for TI InterActive! in graphing parabolas in vertex form. What if you don't have TI InterActive! or a lab to take your students, but you do have a class set of TI-83 or TI-84. This activity...
University College London
University College London: The Graph of Y = Ax Squared + Bx + C
Provides a walkthrough of graphs of quadratic functions, including what factors "shift" or otherwise affect the parabola.
