Curated OER
Point Graphs
Learners experiment with point graphs. For this math lesson, students are divided into groups and perform an experiment to see how high a ball bounces, recording their results on a point graph. Learners then answer provided questions.
Curated OER
Tables, Charts and Graphs
Learners examine a science journal to develop an understanding of graphs in science. In this data analysis lesson, students read an article from the Natural Inquirer and discuss the meaning of the included graph. Learners create a...
Curated OER
Body Measuring Activity
Young scholars explore geometry by participating in a measurement activity. In this human anatomy lesson plan, students identify the appropriate methods to measure human body parts and do so in class. Young scholars create a bar graph...
Curated OER
Scatter Graphs
In this scatter graphs worksheet, students learn a way of illustrating information about two related values. Students complete 30 questions about the graphs. Note: One of the graphs has English pounds. This is intended as an online...
Curated OER
Jellybean Graphs
Second graders predict and graph data based on the color of jelly beans they think are in a handful. In this prediction lesson plan, 2nd graders will predict how many of each color jellybean are in a handful. Then they graph these...
Curated OER
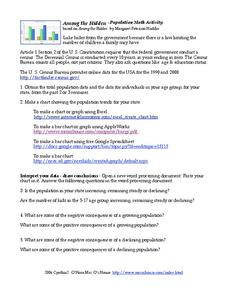
Among the Hidden - Population Math Activity
In this population worksheet, students collect data on population by researching the Census Bureau and then make online graphs and answer short answer questions about the data. Students complete 5 problems total.
Curated OER
Solving Quadratic Equations by Graphing
Pupils solve quadratic equation by graphing. In this algebra lesson, students use the TI calculator to get a visual of their graph. They create a table of values, plot their points and graph the parabola.
Curated OER
Coordinate Graphs
Students use coordinate graphs in order to identify objects and their locations. They are shown how to plot the x and y coordinates and then are given values to be plotted during guided and independent practice. Students are assessed on...
Curated OER
Coordinate Graphs, Translations and Reflections
Students perform translations and reflections. In this algebra lesson, students use the TI calculator to graph functions. They move the functions around on the coordinate plane using translation and reflection.
Curated OER
Heart Rate Graphs
In this graphing worksheet, 5th graders use a line graph to compare and contrast the heartbeats of two athletes in a tennis match.
Curated OER
Linear Graphs and Equations
In this linear graph and equations worksheet, students calculate the gradient of slopes, and find equations of lines in patterns.
Curated OER
Math, Sweet Math Activity Sheet
In this candy graphing worksheet, 1st graders will place candy on their paper to create a bar graph. They will answer several questions based on their data. A teacher checklist is provided.
Curated OER
Making an Exercise Graph
In this making an exercise graph worksheet, 6th graders draw a circle graph that shows the kinds of activities they do for exercise.
Curated OER
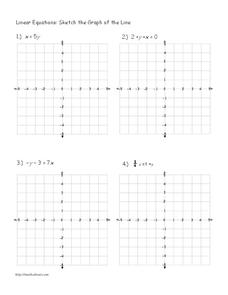
Linear Equations: Sketch the Graph of the Line
In this linear equations worksheet, 6th graders complete 4 problems, sketching the graphs of lines of equations. A reference web site is given for additional activities.
Curated OER
Beatrix Potter Book Survey
In this survey activity, students ask classmates which Beatrix Potter books they have read and record their responses. Book titles are listed in the first column and tally marks are written in the second column. Students then graph the...
Curated OER
Revision Activities
In this revision activities worksheet, students plot the development of tension throughout the book, answer seven questions about plot, analyze characters and theme, and discuss the writing style of the author. Students answer ten short...
Curated OER
Morning Activity
First graders show appropriate ASL hand signs to answer questions for the morning meeting. They show the day of the week, the weather, and mode of transportation to school using signs. They copy the sign of the day and use name cards to...
University of Rhode Island
How Does the Human Body Use Energy during Various Athletic Activities?
Students investigate how much energy is used during different athletic activities. They conduct Internet research to obtain information on the top three athletic sporting events from around the world, and calculate the calories burned...
Curated OER
Graphosaurus
Students complete bar graphing activities with a dinosaur theme. Students discuss their favorite dinosaurs, collect data about the discussion, and make a floor graph of the information. Students complete a dinosaur graph worksheet.
Curated OER
Thanksgiving Travel Activity
For this Thanksgiving activity worksheet, students make a large graph showing whether they would like to travel by plane, train or car. They discuss holiday travel and sing an associated song.
Curated OER
Decisions, Decisions, Decisions
Students examine graphs to find the most appropriate for various kinds of data. In this graphing lesson, student create bar, line and circle graphs. Students create graphs electronically and manually interpreting the data.
Curated OER
Creating Circles
Students make a circle graph. In this graphing lesson, the teacher conducts a class survey, then demonstrates how to make a pie graph. When students are comfortable with the material, they use a worksheet to create their own graph.
Curated OER
Numbers and Me
Students collect and graph data about themselves. In this collecting and graphing data lesson, students poll their classmates about how many siblings they have or they measure their height. Students make a bar graph of their data. ...
Curated OER
What's My Pattern?
Students recognize, describe and extend patterns in three activities. They organize data, find patterns and describe the rule for the pattern as well as use the graphing calculator to graph the data to make and test predictions. In the...
Other popular searches
- Elementary Graphing Activity
- M&m Graphing Activity
- Holiday Graphing Activity
- Line Graphing Activity
- Biology Graphing Activity
- Science Graphing Activity
- Halloween Graphing Activity
- Ell Graphing Activity
- Graphing Activity Velocity
- States Graphing Activity
- Hurricane Graphing Activity
- Free M&m Graphing Activity


