Vision Learning
Visionlearning: Data: Using Graphs and Visual Data in Science
An explanation of how data can be turned into visual forms which can help people comprehend information easier than observing numbers.
Shodor Education Foundation
Shodor Interactivate: Comparison of Univariate and Bivariate Data
Students learn about the difference between univariate and bivariate data and understand how to choose the best graph to display the data.
BSCS Science Learning
Bscs: Invitations to Inquiry With Data Using Field Scope
Invitations to Inquiry are short instructional activities designed to help middle and high school students work with large data sets. Teachers and students use the interactive FieldScope platform to collect, visualize, and analyze...
Khan Academy
Khan Academy: Basics of Enzyme Kinetics Graphs
Learn about the basics of enzyme kinetics graphs, and see examples of the graphs to understand the valuable data that is found on the graph. [12 min, 29 sec]
PBS
Pbs: Location Graphs
Use your skills of deduction to fill in the missing information and demonstrate your expertise at interpreting graphs. This interactive exercise focuses on how line graphs can be used to represent data and provides an opportunity to...
NASA
Nasa: Sea Surface Temperature Trends of the Gulf Stream
Students investigate changes in the surface temperatures of the Gulf Stream over the course of the seasons using data collected by NASA's satellites. The data is inputted into a spreadsheet and graphed.
PBS
Pbs Kids Afterschool Adventure!: Operation: All About Us Activity Plan
It's time to stand in the spotlight! During this Afterschool Adventure, children will learn about and practice a variety of math skills as they gather information about their favorite subject-themselves! Children will start out by...
University Corporation for Atmospheric Research
Ucar: Get the Picture Severe Weather
Students review graphs and charts of severe weather data then answer "True and False" questions about the content conveyed.
Math Slice
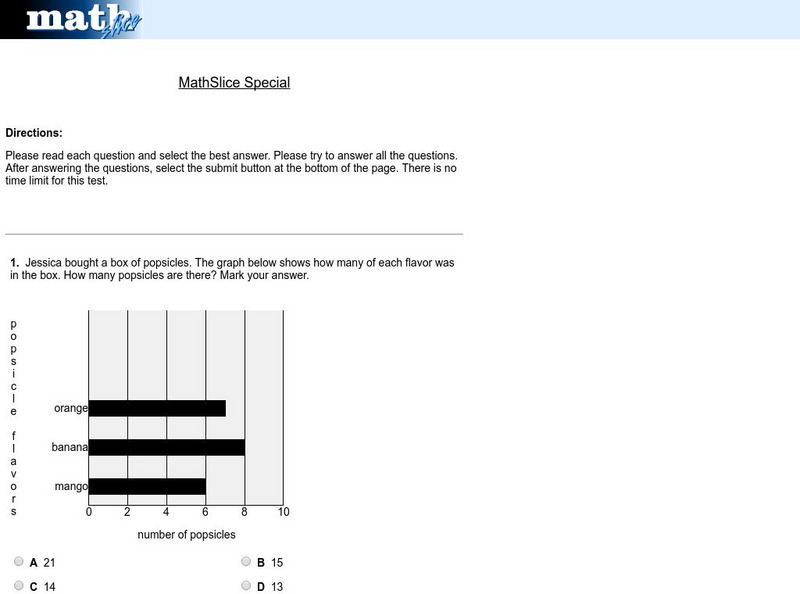
Math Slice: Chart Slice Special Test
A ten question test assessing data collection and analysis skills with bar graphs. Assessment is scored online. An excellent tool for assessment.
BioEd Online
Bio Ed Online: Balloon Blast
In the following lesson students are asked to devise a plan to measure the distance of a balloon's flight, predict the direction a balloon will travel as it deflates, learn about Newton's Laws of Motion, experience Newton's Third Law,...
BSCS Science Learning
Bscs: Frog Eat Frog World
Using maps and graphs of large data sets collected in FrogWatch, learners will determine the range, preferred land cover, and proximity to water of the American bullfrog to figure out the bullfrog's requirements for food, water, and...
Illustrative Mathematics
Illustrative Mathematics: 8.sp.4 Music and Sports
This task looks at a possible relationship between playing a sport and playing a musical instrument. Students collect data from classmates, summarize the data into a two-way table, make some observations, and construct a bar graph of the...
Illustrative Mathematics
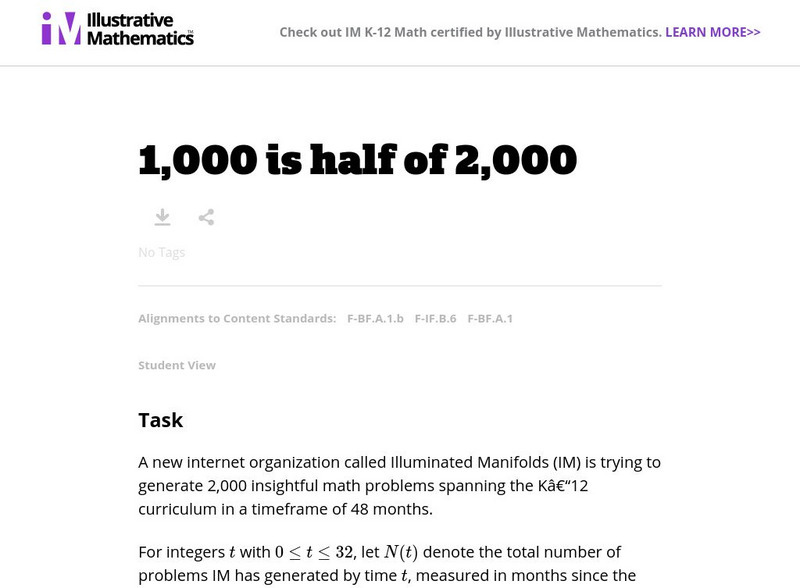
Illustrative Mathematics: F Bf 1,000 Is Half of 2,000
This task is about an online mathematics organization that is trying, over a four-year period, to generate 2,000 math problems that cover all grades. This real-life modeling task could serve as a summative exercise that draws on many...
Illustrative Mathematics
Illustrative Mathematics: 8.f Us Garbage, Version 1
Eighth graders work with input values (the year) and output values (the amount of garbage that year) in a table about the garbage produced in the US. They study the table to answer specific questions, state whether it represents a linear...
Khan Academy
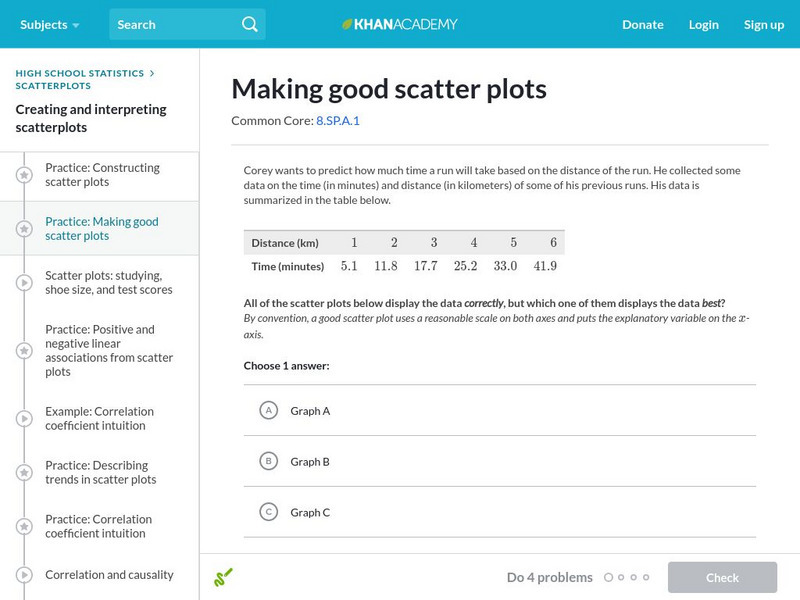
Khan Academy: Making Good Scatter Plots
A good scatter plot has the independent variable on the x-axis and the dependent variable on the y-axis. Also, the scale of both axes should be reasonable, making the data as easy to read as possible. In these practice problems, we...
US National Archives
Nara: Explaining Trends in the Gender Wage Gap
This White House site provides a report on the gender wage gap by the Council of Economic Advisers. Includes historical data and statistical information, information on the different factors that affect gender pay, what pay...
Other
The Learning Partnership: Journey to El Yunque
In this set of learning modules, students examine the impact of hurricane weather on the El Yunque rainforest in Puerto Rico. They learn about hurricanes, producers, consumers, and the food chain, and how disruptions in organisms'...
PBS
Pbs: Real World Proportional Relationships: Gender Wage Gap
Using this infographic, learn how wage equity today compares with data from 50 years ago, at the dawn of the equal pay movement. The accompanying classroom activity invites students to explore the change in the gender wage gap from 1965...
Better Lesson
Better Lesson: Say It With Stats! Review
The students will be working in centers to review for their test. The centers will consist of a computer rotation, versa-tiles, and a teacher center. All centers will reinforce concepts learned throughout this unit to prepare them for...
Science and Mathematics Initiative for Learning Enhancement (SMILE)
Smile: Lab Work Forces & Acceleration
The Illinois Institute of Technology provides this site. The site contains a graphing activity which illustrates that a constant force exerted upon an object results in constant acceleration. Rolling carts and stopwatches are used to...
Other popular searches
- Graphing Data
- Data Analysis Graphing
- Data and Graphing
- Graphing Data Project
- Collecting and Graphing Data
- Graphing Data in Science
- Collecting Data Graphing
- Organizing and Graphing Data
- Mathematics Graphing Data
- Data Tables and Graphing
- Analyzing Data and Graphing
- Graphing Information


