Rice University
Introductory Statistics
Statistically speaking, the content covers several grades. Featuring all of the statistics typically covered in a college-level Statistics course, the expansive content spans from sixth grade on up to high school. Material...
Ed Migliore
Linear Equations in Two Variables
This traditional textbook style unit includes vocabulary, a direct explanation section, examples, practice problems that directly line up with the explanations and examples, and a unit summary review and practice problems. Learners get...
CK-12 Foundation
CK-12 Middle School Math Concepts - Grade 6
Twelve chapters cover a multitude of math concepts found in the Common Core standards for sixth grade. Each title provides a brief explanation of what you will find inside the chapter—concepts from which you can click on and learn more...
Savvas Learning
Saxon Math 5/4
You'll never have to search for another worksheet again after downloading this extensive collection of Saxon math materials. With over 600 pages of example problems and skills practice exercises, this is a must-have resource...
Other
Online Statistics Education: Graphing Distributions [Pdf]
This is the second chapter of a statistics e-text developed collaboratively by Rice University, University of Houston Clear Lake, and Tufts University. It looks at many different types of data displays and the advantages and...
Khan Academy
Khan Academy: Representing Graphs
There are several ways to represent graphs, each with its advantages and disadvantages. Some situations, or algorithms that we want to run with graphs as input, call for one representation, and others call for a different representation....
Houghton Mifflin Harcourt
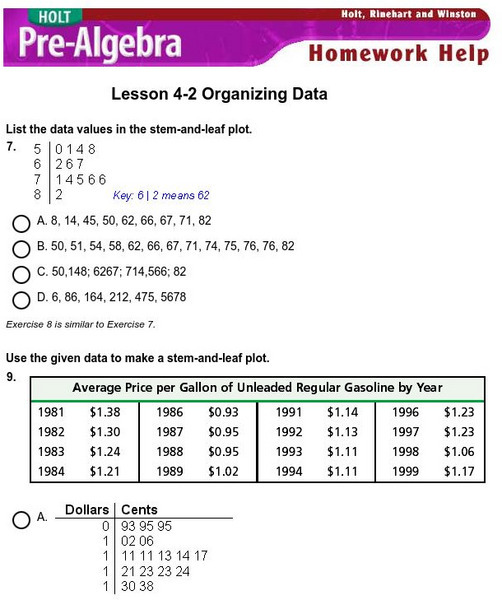
Holt, Rinehart and Winston: Homework Help Independent Practice: Stem and Leaf Plot
Get independent practice organizing data and using stem-and-leaf plots. Each incorrect response gets a text box explanation and another try. Correct responses are confirmed.
CK-12 Foundation
Ck 12: Algebra Ii: 5.4 Standard Deviation
Explore what the standard deviation is as it relates to the graph of a normal distribution curve.
Other popular searches
- Graphing Data
- Data Analysis Graphing
- Data and Graphing
- Graphing Data Project
- Collecting and Graphing Data
- Graphing Data in Science
- Collecting Data Graphing
- Organizing and Graphing Data
- Mathematics Graphing Data
- Data Tables and Graphing
- Analyzing Data and Graphing
- Graphing Information


![Online Statistics Education: Graphing Distributions [Pdf] eBook Online Statistics Education: Graphing Distributions [Pdf] eBook](https://d15y2dacu3jp90.cloudfront.net/images/attachment_defaults/resource/large/FPO-knovation.png)

