Curated OER
Dependence of Light Intensity on Distance
Hopefully you have a sensor interface for your physics class to use with graphing calculators when collecting data with a light sensor. If so, read on. Use this resource for learners to predict and then test whether or not the intensity...
Curated OER
Time That Period
Physical science starters play with a pendulum in order to experience periodicity. Detailed procedures and a worksheet are included for day one. For day two, learners will use a graphing calculator to help them plot orbit data from a...
Texas Instruments
TI-Nspire™ CAS
When it comes to rating educational calculators, this calculator is always near the top of this list. Now it's available as an app. There is a lot of calculator power wrapped up in this app. Not only is this a fully functioning...
Curated OER
Ashes to Ashes: Using Evaporation Rate to Identify an Unknown Liquid
Learners explore the concept of evaporation rates in this evaporation rates lesson. They will try to identify the chemical that began a fire, perform an experiment where they use the evaporation rates to determine the unknown liquid, and...
Curated OER
Graphing the Four Forces
Using the Cartesian coordinate system, future flight experts plot points to determine whether or not an airplane will fly. With the four forces of weight, lift, drag, and thrust represented in different quadrants, your physics learners...
Curated OER
Student - Designed Density Experiment and Poster
In this student-designed experiment worksheet, learners decide on an experimental problem to solve. Students use the scientific method to perform an experiment and record the data. Learners calculate the density of liquid used in the...
Beyond Benign
Product Test
It's the moment of truth. Previous lessons in the 24-part series had scholars design and develop shampoo formulas using chemical concepts. The 18th lesson asks them to test the function of their shampoos. To do this, they calculate the...
Curated OER
Food Type And Calories Per Square Meter
Students compare the efficiency of producing food calories in different types of food then calculate how much land is required to supply their food for a year. They then graph the results.
Curated OER
One Square Foot
Students identify, describe, count, tally, and graph life found in one square foot of land.
Teach Engineering
Air Pressure
Investigate what is pushing on us. An intriguing lesson has pupils calculate the amount of force on various squares due to air pressure. Using the data, individuals create a graph in the third lesson of the Up, Up and Away unit...
Curated OER
Turn Up the Volume
Measuring volume can be a mystery for 5th graders, but this hands-on activity gives the gift of discovery. The volume of simple rectangular solids and irregular shapes are calculated through various methods including displacing liquid in...
Curated OER
Annual Wetland Plant Diversity Survey
Students locate an area of marsh and, by measuring the total number of individual plants in a sample area, determine whether purple loosestrife population density is correlated to the total plant diversity of the community. They...
Curated OER
Lift/Velocity Relationship Problem Set
Students, after reading an explanation from a NASA Web-based textbook, demonstrate their ability to use, graph (using a graphing calculator), and interpret a text equation.
Curated OER
Exponential Decay
Students study exponential decay and its application to radiocarbon dating. In this exponential decay lesson, students use candy to model the time it takes for something to decay. Students also graph the data they collect and...
NASA
Just How Far is That Star?
Pupils often wonder how we know the distance to various stars. Starting with a thought experiment and progressing to a physical experiment, they determine the brightness and distance to various stars. The evaluation requires...
Curated OER
Grid Frame Mapping
Students map and describe small area of the schoolyard and discuss habitats.
Curated OER
I Breath What? Activity-Pollution Detector Worksheet
In this pollution worksheet, learners collect particles using a pollution detector and then observe their results under the microscope. They calculate the average number of particles collected in three different locations. They...
Curated OER
Linear Motion 4
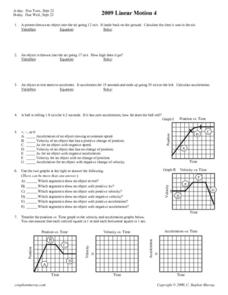
For this linear motion worksheet, students answer 12 questions including finding acceleration of moving objects, calculating distance objects travel and determining the time of travel. Students interpret graphs of position vs. time,...
Curated OER
How Big is a Molecule?
High schoolers calculate the size of a molecule. In this molecules and their sizes lesson plan, students find the size of an oleic acid molecule by using a measured amount of drops of oleic acid to find the volume of the sample, the...
Curated OER
Galileo's Battle for the Heavens
Students view a video about Galileo's discoveries. They work together to create graphs showing the current sunspot cycle. They discuss how sunspots can cause communication devices problems.
Curated OER
Linear Motion 5
In this linear motion activity, students answer 9 questions about velocity, acceleration and position of objects. They solve problems for acceleration and velocity and they interpret graphs of velocity vs. time, acceleration vs. time and...
Curated OER
Surface Area of a Leaf (Grades 7-9)
In this math and science learning exercise, learners read about the process of photosynthesis and plant growth. They determine how a plant's ability to create food is dependent on the surface area of its leaves using geometric...
Curated OER
Deer: Predation or Starvation
In this predation or starvation worksheet, students read about the effects of the wildlife service bringing in predators (wolves) to control a deer population. Students calculate the change in the deer population from 1971 to 1980. They...
Curated OER
Deer: Predation or Starvation
In this balance of nature worksheet, students use a data chart to graph wolf and deer populations over a ten-year period. Students use this graph to complete 3 short answer questions.


