Varsity Tutors
Varsity Tutors: Hotmath: Graphing Calculator Practice Problems Areas and Volumes
Practice using your graphing calculator for area and volume problems. If you get stumped or if you would like to check your work, then select the View Solution button, which is located directly under each problem.
Texas Education Agency
Texas Gateway: Analyzing the Effects of Changes in "A" on the Graph Y=ax^2 + C
Given verbal, graphical, or symbolic descriptions of the graph of y = ax^2 + c, the student will investigate, describe, and predict the effects on the graph when "a" is changed.
Shodor Education Foundation
Shodor Interactivate: Graph Sketcher
Students can create graphs of functions entered as algebraic expressions similar to a graphing calculator.
Oswego City School District
Regents Exam Prep Center: Factoring Trinomials (A=1)
This site from the Oswego City School District shows students how to factor trinomials when the leading coefficient is equal to 1. The example walks students through the process so they can learn to do it on their own. Includes link to...
Oswego City School District
Regents Exam Prep Center: Multiple Choice Practice: Coordinate Geometry
Test your knowledge of coordinate geometry by taking this twenty question multiple-choice practice test. Use a graphing calculator to help with any graphing problems and check your answers at any given time throughout the test.
Oswego City School District
Regents Exam Prep Center: Graphically Represent the Inverse of a Function
Investigates how to graph the inverse of a function. There is also an explanation that involves the use of a graphing calculator.
Oswego City School District
Regents Exam Prep Center: Multiply and Divide Complex Numbers
This tutorial shows students how to multiply and divide complex numbers and includes the topic of conjugates. Includes link to a graphing calculator tutorial.
Texas Education Agency
Texas Gateway: Ap Physics: 2.3 Time, Velocity, and Speed
By the end of this section, you will be able to do the following: Explain the relationships between instantaneous velocity, average velocity, instantaneous speed, average speed, displacement, and time; Calculate velocity and speed given...
Oswego City School District
Regents Exam Prep Center: Regression Analysis
A collection of lesson ideas, a practice activity, and teacher resources for exploring regression analysis.
Texas Education Agency
Texas Gateway: Collecting Data and Making Predictions
Given an experimental situation, the student will write linear functions that provide a reasonable fit to data to estimate the solutions and make predictions.
Oswego City School District
Regents Exam Prep Center: Multiple Choice Practice: Working With Data
Test your knowledge of working with data by taking this twenty question multiple-choice practice test. Use a graphing calculator to help with any graphing problems and check your answers at any given time throughout the test.
Shodor Education Foundation
Shodor Interactivate: Graphit
Create graphs of functions and sets of ordered pairs on the same coordinate plane. This is like a graphing calculator with advanced viewing options.
Texas Instruments
Texas Instruments: Discovering Ohm's Law
In this activity, students use voltage and current probes to investigate Ohm's Law. The students collect data and use their graphing calculators to perform data analysis and "discover" Ohm's Law.
Oswego City School District
Regents Exam Prep Center: Multiple Choice Practice: Equations and Inequalities
Check your understanding of equations and inequalities by completing this multiple-choice practice test. You may use a graphing calculator to solve the problems and check your answers at any given time.
Shodor Education Foundation
Shodor Interactivate: Linear Inequalities
Students create linear inequalities and systems of linear inequalities on a coordinate plane. This is like a graphing calculator with advanced viewing options.
Oregon State University
Calculus Quest: Power Functions
This CalculusQuest site is details the power function by looking at the significance of the function, standard notation, the rules of exponentiation, domains and graphs of power functions, and also calculations. This site is a good...
Illustrative Mathematics
Illustrative Mathematics: F If.6 Mathemafish Population
For this task, learners are presented with a table and a graph and are asked to summarize the data and report the findings of a project by the Environmental Protection Agency to contain the effects of an invasive species on a fish...
Illustrative Mathematics
Illustrative Mathematics: 8.f Chicken and Steak, Variation 1
This task has students find a linear function that will calculate the amount of chicken and steak to purchase in order to stay within a given budget. Students then graph the function and interpret it. Aligns with 8.F.B.4.
Council for Economic Education
Econ Ed Link: Focus on Economic Data: The Inflation Rate
Explore the inflation rate from 2013 through this informative case study. Trace the consumer trends through the graphs and charts on the site.
Illustrative Mathematics
Illustrative Mathematics: F if Average Cost
In this task, students must calculate the average cost for a DVD recording for different numbers of DVDs and explain why the cost levels off as the number of DVDs goes up. Aligns with F-IF.B.4 and F-IF.B.5.
Texas Instruments
Texas Instruments: Numb3 Rs: Exponential Growth
Based off of the hit television show NUMB3RS, this lesson introduces students to the concept of exponential growth, especially in comparison to linear growth. This is done in the context of weekly allowances, in which one group earns a...
Purple Math
Purplemath: Scatterplots and Regressions
Explains the purpose of scatterplots, and demonstrates how to draw them.
Texas Education Agency
Texas Gateway: The Language of Physics: Physical Quantities and Units
By the end of this section, you will be able to associate physical quantities with their International System of Units (SI) and perform conversions among SI units using scientific notation; relate measurement uncertainty to significant...
Texas Education Agency
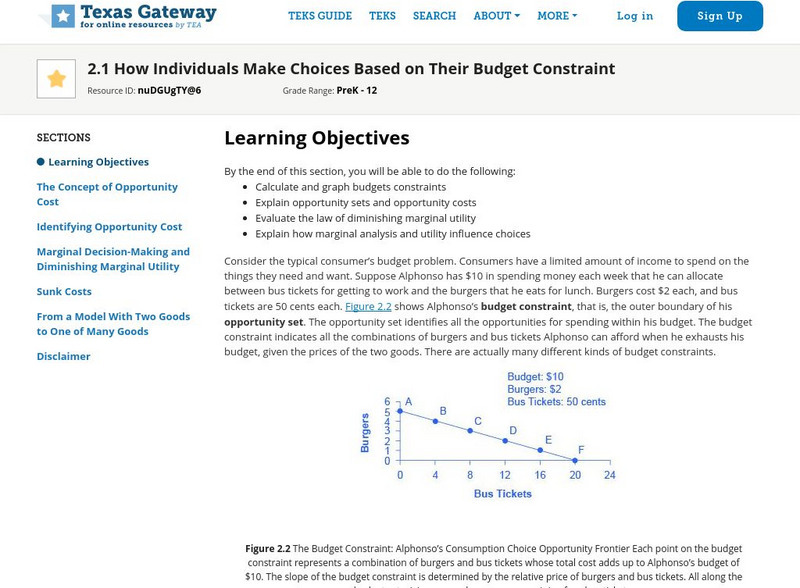
Texas Gateway: How Individuals Make Choices Based on Their Budget
By the end of this section, you will be able to calculate and graph budgets constraints, explain opportunity sets and opportunity costs, evaluate the law of diminishing marginal utility, and explain how marginal analysis and utility...


