Varsity Tutors
Varsity Tutors: Hotmath: Graphing Calculator Practice Problems Areas and Volumes
Practice using your graphing calculator for area and volume problems. If you get stumped or if you would like to check your work, then select the View Solution button, which is located directly under each problem.
Calculator Soup
Calculator Soup: Descriptive Statistics Calculator
This is a statistics calculator; enter a data set and hit calculate. Descriptive statistics summarize certain aspects of a data set or a population using numeric calculations. Examples of descriptive statistics include: mean, average,...
Texas Education Agency
Texas Gateway: Determining Parent Functions (Verbal/graph)
Given a graph or verbal description of a function, the student will determine whether the parent function is quadratic or linear.
Shodor Education Foundation
Shodor Interactivate: Graph Sketcher
Students can create graphs of functions entered as algebraic expressions similar to a graphing calculator.
Smithsonian Institution
National Museum of American History: Slates, Slide Rules and Software
Did you learn to calculate using a 7-foot-long slide rule? Did you learn about the properties of numbers using brightly colored Cuisenaire rods? Ever wonder who invented the graph paper you used in geometry class? Go back to the...
Oswego City School District
Regents Exam Prep Center: Multiple Choice Practice: Coordinate Geometry
Test your knowledge of coordinate geometry by taking this twenty question multiple-choice practice test. Use a graphing calculator to help with any graphing problems and check your answers at any given time throughout the test.
Texas Education Agency
Texas Gateway: Ap Physics: 2.3 Time, Velocity, and Speed
By the end of this section, you will be able to do the following: Explain the relationships between instantaneous velocity, average velocity, instantaneous speed, average speed, displacement, and time; Calculate velocity and speed given...
Oswego City School District
Regents Exam Prep Center: Regression Analysis
A collection of lesson ideas, a practice activity, and teacher resources for exploring regression analysis.
Texas Education Agency
Texas Gateway: Collecting Data and Making Predictions
Given an experimental situation, the student will write linear functions that provide a reasonable fit to data to estimate the solutions and make predictions.
Shodor Education Foundation
Shodor Interactivate: Graphit
Create graphs of functions and sets of ordered pairs on the same coordinate plane. This is like a graphing calculator with advanced viewing options.
Texas Instruments
Texas Instruments: Discovering Ohm's Law
In this activity, students use voltage and current probes to investigate Ohm's Law. The students collect data and use their graphing calculators to perform data analysis and "discover" Ohm's Law.
Oswego City School District
Regents Exam Prep Center: Multiple Choice Practice: Equations and Inequalities
Check your understanding of equations and inequalities by completing this multiple-choice practice test. You may use a graphing calculator to solve the problems and check your answers at any given time.
Shodor Education Foundation
Shodor Interactivate: Linear Inequalities
Students create linear inequalities and systems of linear inequalities on a coordinate plane. This is like a graphing calculator with advanced viewing options.
Oregon State University
Calculus Quest: Power Functions
This CalculusQuest site is details the power function by looking at the significance of the function, standard notation, the rules of exponentiation, domains and graphs of power functions, and also calculations. This site is a good...
NOAA
Noaa: Ngdc: Sunspot Numbers
This brief article examines the historical work on sunspot recording by Rudolph Wolf. Also discusses how sunspot numbers are calculated today and provide graphs of sunspots numbers from past years.
Illustrative Mathematics
Illustrative Mathematics: F If.6 Mathemafish Population
For this task, learners are presented with a table and a graph and are asked to summarize the data and report the findings of a project by the Environmental Protection Agency to contain the effects of an invasive species on a fish...
Illustrative Mathematics
Illustrative Mathematics: 8.f Chicken and Steak, Variation 1
This task has students find a linear function that will calculate the amount of chicken and steak to purchase in order to stay within a given budget. Students then graph the function and interpret it. Aligns with 8.F.B.4.
Illustrative Mathematics
Illustrative Mathematics: F if Average Cost
In this task, students must calculate the average cost for a DVD recording for different numbers of DVDs and explain why the cost levels off as the number of DVDs goes up. Aligns with F-IF.B.4 and F-IF.B.5.
Purple Math
Purplemath: Scatterplots and Regressions
Explains the purpose of scatterplots, and demonstrates how to draw them.
Other
Conflict Casualties Monitor: Iraq Body Count
This site calculates the current number of civilian deaths in Iraq due to the war and suicide bombings. In addition, it provides a number of graphs, tables, and articles that illustrate the terrible cost of war as well as a detailed...
TeachEngineering
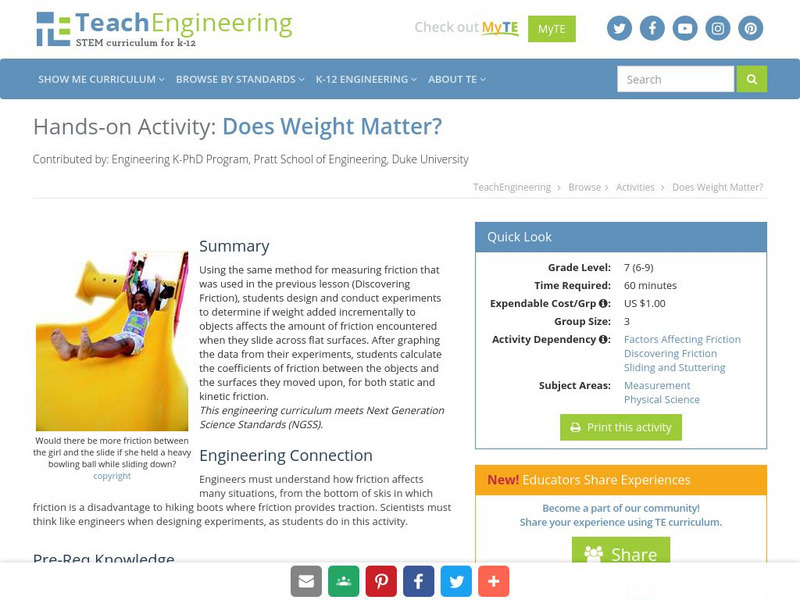
Teach Engineering: Does Weight Matter?
Using the same method for measuring friction that was used in the previous lesson (Discovering Friction), students design and conduct an experiment to determine if weight added incrementally to an object affects the amount of friction...
Texas Education Agency
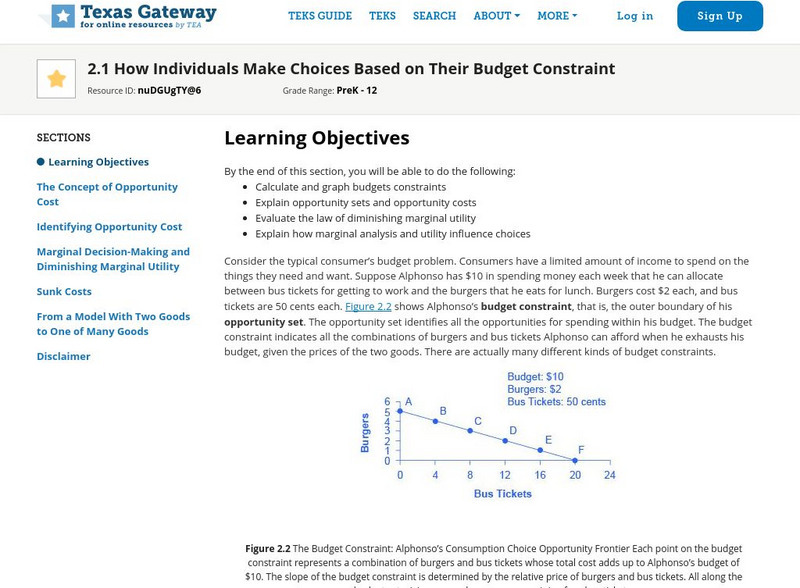
Texas Gateway: How Individuals Make Choices Based on Their Budget
By the end of this section, you will be able to calculate and graph budgets constraints, explain opportunity sets and opportunity costs, evaluate the law of diminishing marginal utility, and explain how marginal analysis and utility...
PBS
Pbs Kids Afterschool Adventure!: Operation: Martha's Stem Stories Activity Plan
Welcome to Martha's STEM Stories! STEM stands for science, technology, engineering, and mathematics. You may already know that doing STEM means testing ideas, collecting data, making calculations, and drawing graphs and charts-but you...
Utah Education Network
Uen: Wavelength and Energy
Students will calculate energy, frequency, or wavelength. After calculating, students graph their data and answer analysis questions.


