Varsity Tutors
Varsity Tutors: Hotmath: Graphing Calculator Practice Problems: Proportions
Practice using your graphing calculator for solving proportion problems. If you get stumped or if you would like to check your work, then select the View Solution button, which is located directly under each problem.
Varsity Tutors
Varsity Tutors: Hotmath: Graphing Calculator Practice Problems: Geometry
Practice using your graphing calculator for geometry problems, including the use of the Pythagorean Theorem and the distance formula. If you get stumped or if you would like to check your work, then select the View Solution button, which...
University of South Florida
Fcat: Get a Half Life!: Teacher Notes
Learners use M&M's and a graphing calculator to collect and graph data. This activity helps them to understand exponential functions and the concept of half-life.
University of South Florida
Florida Center for Instructional Tech: Wacky Water World
At this site investigate linear equations with a graphing calculator. Data is gathered from a hypothetical situation of purchasing tickets at a waterpark.
CK-12 Foundation
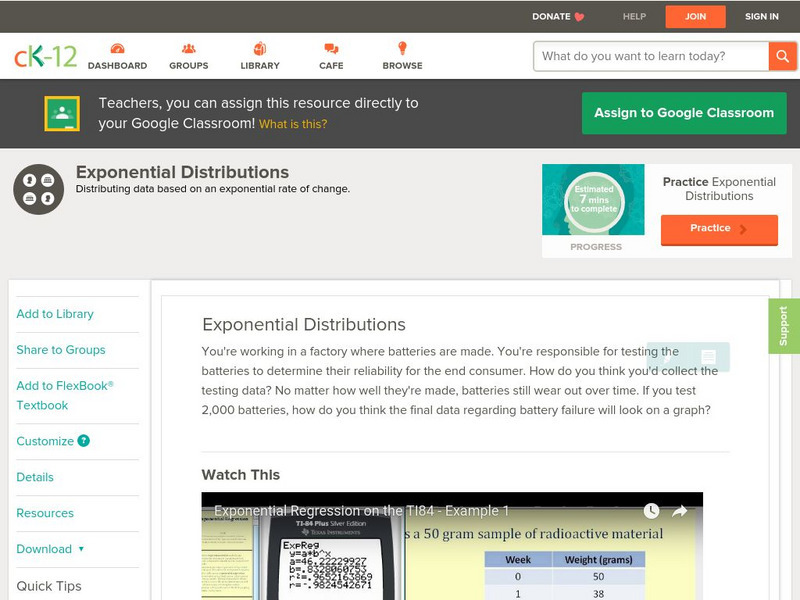
Ck 12: Probability: Exponential Distributions
[Free Registration/Login may be required to access all resource tools.] Covers exponential distributions. Presents examples using a graphing calculator as well as guided and independent practice questions.
CK-12 Foundation
Ck 12: Probability: Theoretical and Experimental Probability
[Free Registration/Login may be required to access all resource tools.] Here you'll learn about theoretical and experimental probability, including how to describe sample spaces and how to conduct probability simulations. Includes...
Wyzant
Wyzant: Calculators Index
Online calculators will help you solve equations, factor, complete the square, simplify, graph, and substitute.
Oswego City School District
Regents Exam Prep Center: Multiple Choice Practice: Probability
Test your knowledge of probability by taking this twenty question multiple-choice practice test. Use a graphing calculator to help with any graphing problems and check your answers at any given time throughout the test.
Math Slice
Math Slice: Graph Slice Special Test
A ten question test for assessing measurement concepts of area and perimeter. Assessment is scored online and student scores are compared with other students who have taken the assessment. Great assessment tool.
CK-12 Foundation
Ck 12: Trigonometry: Amplitude, Period, and Frequency
[Free Registration/Login may be required to access all resource tools.] Combine calculations for amplitude and period on a sine or cosine graph.
PBS
Pbs Teachers: Supersonic Dream
Examine how fuel use affects the mass of different planes during flight. This activity teaches students how to determine the per person fuel cost of a transatlantic flight for seven airplanes, and display the results on a bar graph....
Oswego City School District
Regents Exam Prep Center: Adding and Subtracting Complex Numbers
This site contains great information on adding and subtracting complex numbers. Several examples are given, along with a brief definition. Includes link to a graphing calculator tutorial.
TeachEngineering
Teach Engineering: A Tornado in My State?
Students will analyze data of tornadoes throughout the United States. They will create a bar graph of the number of tornadoes for the top ten states in the country and then calculate the median and the mode of the data.
Science Struck
Science Struck: Instantaneous Velocity: Meaning, Formulas, Examples
Explains what is meant by instantaneous velocity and the formula used to calculate it. Provides sample problems with solutions.
Missouri State University
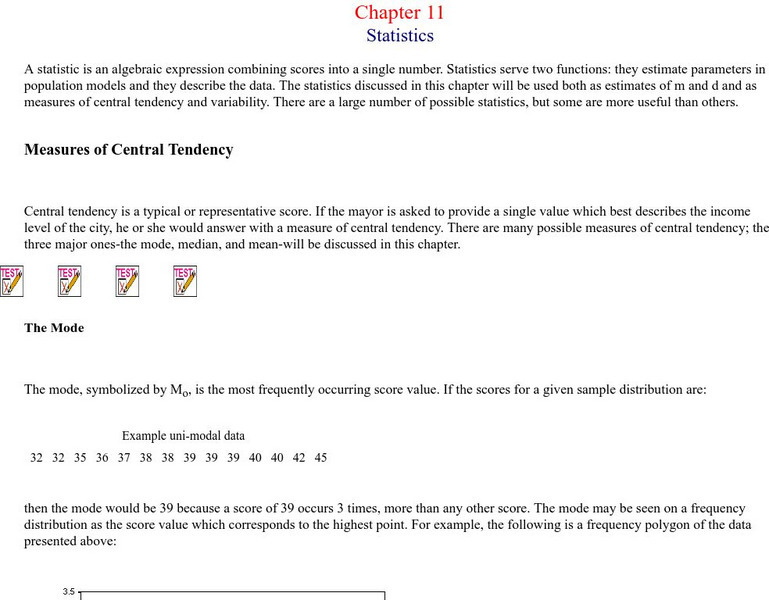
Missouri State University: Introductory Statistics: Statistics
This is an excellent resource on what the science of statistics involves. There are all kinds of definitions, examples, graphs, and charts to learn from. The topics covered include: mode, mean, median, skewed distributions and measures...
TeachEngineering
Teach Engineering: Cost Comparisons
Students learn about the many types of expenses associated with building a bridge. Working like engineers, they estimate the cost for materials for a bridge member of varying sizes. After making calculations, they graph their results to...
University of Illinois
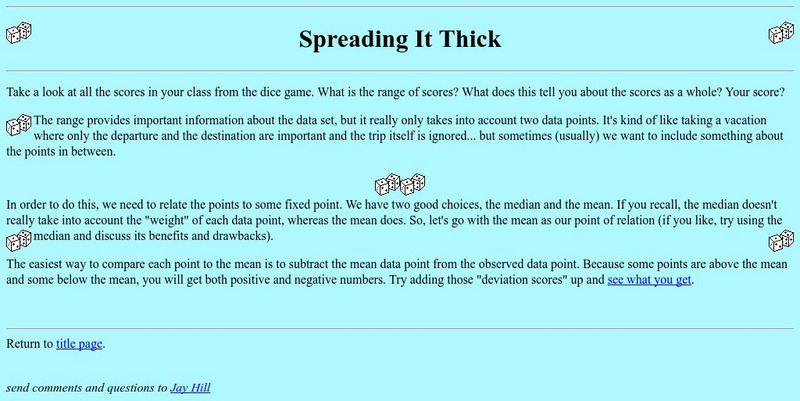
University of Illinois: Spreading It Thick
Resource contains the definition for variance. It also shows students how to calculate the variance. There is a link to a bar graph that displays variance for the data example.


