Virginia Department of Education
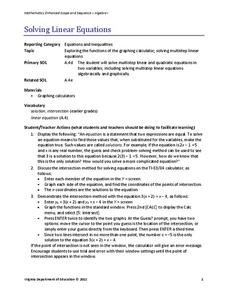
Solving Linear Equations
Practice solving linear equations by graphing. Scholars learn to solve multi-step linear equations in one variable by graphing both sides of the equation separately. They use graphing calculators to find the intersection of the graphs.
EngageNY
Interpreting Correlation
Is 0.56 stronger than -0.78? Interpret the correlation coefficient as the strength and direction of a linear relationship between two variables. An algebra lesson introduces the correlation coefficient by estimating and then calculating it.
Curated OER
Connecting Factors and Zeros
In this Algebra II lesson, young scholars explore the connection between the factored form of a quadratics and the zero of a function. Students use a graphing calculator to verify factoring numerically and graphically.
Curated OER
Ratios in Right Triangles
Learners calculate the sides of right triangles in this trigonometric ratios instructional activity. They use Cabri Jr. software and TI-83 or TI-84 calculators to find the side lengths and their ratios to each other for various...
Curated OER
Coming Clean About Showering Time
Learners measure objects using the Cabri Jr. application in this technology instructional activity. Your class will explore the TI-83 and 84 incorporated with Cabri Jr. to solve business related problems. This is a technology based...
Curated OER
Mean, Median, and Mode
Eighth graders practice using the LIST key on graphing calculators using the proper syntax. They work with the functions of mean, median, and mode in a teacher led lesson and then with a partner on a second data set. They follow...
Curated OER
The Closer I Get To You
Pupils explore the law of reflection. Through experimentation and problem solving, they collect and analyze data pertaining to reflection. The data is plotted on a graph and formulas for calculating the x and y values are evaluated.
Curated OER
Finding the Extrema Graphically and Symbolically
For this extrema worksheet, students use the first derivative test and the second derivative test to determine the local extrema. They identify the local maximum and global maximum. This eight-page worksheet contains detailed...
Curated OER
Approaching Limits
With the assistance of their Ti-84/Ti-83 Plus calculators, students develop a foundation for the limiting process as well as estimate limits from graphs and tables of values. They view how a function behaves as the input approaches a...
Curated OER
Average Rate of Change, Difference Quotients, and Approximate Instantaneous Rate of Change
Pupils, with the assistance of their TI-84 Plus / TI-83 Plus calculators, distinguish meanings from right, left and symmetric difference quotients that include rate of change and graphical interpretations. They utilize symmetric...
Curated OER
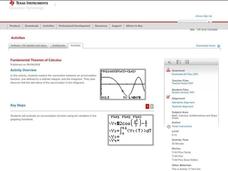
Fundamental Theorem of Calculus
High schoolers, with the assistance of their TI-84 Plus / TI-83 Plus calculators, explore and assess the connections between an accumulation function, one defined by a definite integral, and the integrand. They summarize that the...
Curated OER
The Wave of the Future
Twelfth graders discuss sine curves and enter equations into their graphing calculator then compare different graphs created on their calculators. They identify the period, amplitude and phase shift given the graph or the equation of a...
Curated OER
Means of Growth
Students collect and graph data. In this statistics lesson, students analyze their plotted data using a scatter plot. They identify lines as having positive, negative or no correlation.
Curated OER
Slopes and Lines
Pupils identify the slopes of a line. In this algebra lesson plan, students calculate the slope and intercept of a line. They graph their lines using a TI calculator.
Curated OER
Know the System
Learners identify the different systems of equations. In this algebra lesson plan, students solve systems of equations using graphing, elimination and substitution. They use the Ti to graph their systems.
Curated OER
Statistics
High schoolers log their computer usage hours. They determine the mean, median, mode and standard deviation of the collected data. They make a frequency histogram of the grouped data, both on graph paper, and on the TI 83+ graphing...
Curated OER
Baseball Statistics
Students take an in depth examine baseball record breakers. They calculate statistics, not just for one year, but over whole careers, to compare some famous players and find who was the best all-time home run hitter.
Curated OER
Worksheet #2.6: MT-A141 PreCalculus
In this graphing instructional activity, students predict how a graph of given functions will work. Next, they check their work using a graphing calculator. Students use algebra to complete the graph of a square and determine...
Curated OER
Worksheet 2.4/2.5: MT-A141 PreCalculus
In this precalculus worksheet, students use their graphing calculator to graph the domain and range of given terms. They write parametric equations and identify the coordinates of the points on the relation given certain terms.
Curated OER
Elements of a Short Story
Young scholars analyze elements of a short story by working together. In this literature lesson plan, students analyze short stories. They use the TI Navigator Application to write their findings.
Curated OER
Big Wheels Keep on Turning
Eleventh graders work in groups and investigate how force determines the speed and distance then they view the video, "Math Vantage #7: What's Your Angle?." They are given a real life problem to solve using speed, ramps, angle, incline...
Curated OER
Regressive Music
Student use the Ti calculator to graph sinusoidal graphs. In this calculus lesson, high schoolers use the CBL to collect and analyze data of sinusoidal graphs. They manipulate their collected data and make predictions.
Curated OER
The Swinging Pendulum
Students observe a pendulum and graph their observation. In this algebra lesson, students use the TI calcualtor to graph the motion the pendulum makes. They analyze the graph and make predictions.
Curated OER
Round and Round and Round We Go!
Students investigate motion using a CBL. In this algebra lesson, students collect and graph data on a coordinate plane. They define and identify amplitude and period of conic graphs.


